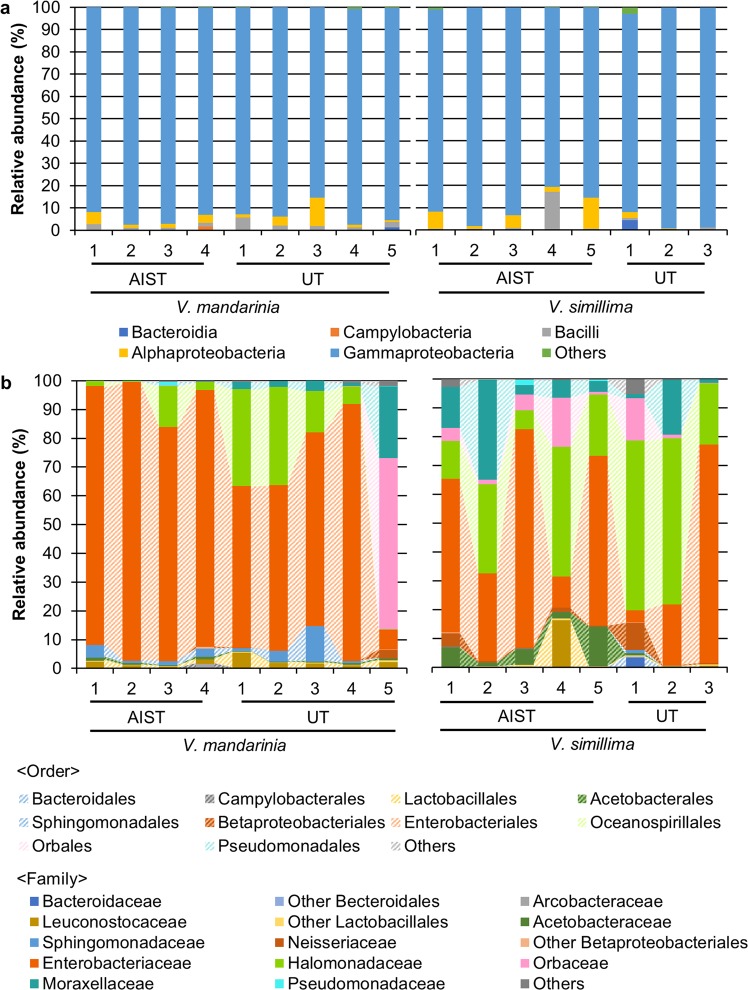
Figure 2.
Relative abundance of OTUs in individual gut microbiome. (a) Bar plots on relative abundances of OTUs annotated at the class level. (b) Same as A but the order and family levels. Order is represented by area chart, while family is shown by bar plots. Taxonomies whose abundance was less than 1% are included in ‘Others’. Taxonomic classification was performed based on SILVA. AIST, the National Institute of Advanced Industrial Science and Technology; UT, the University of Tokyo.

