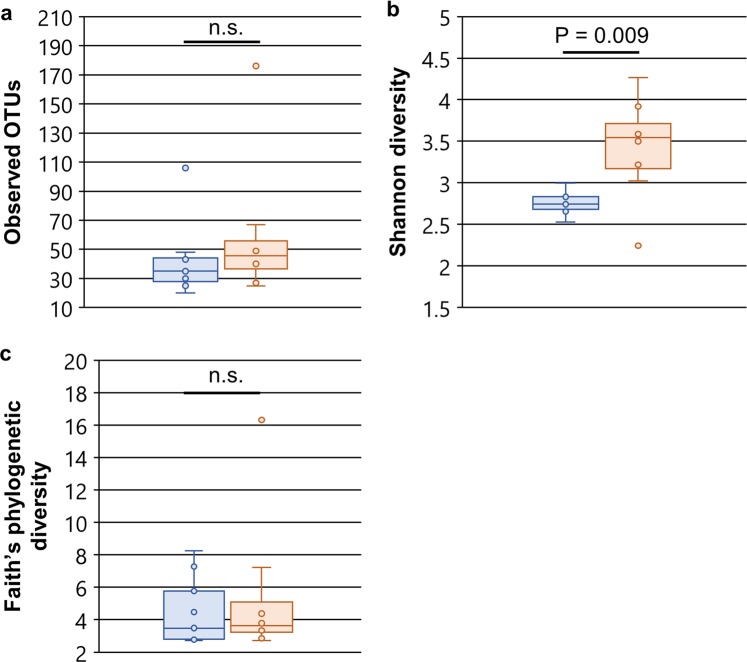
Figure 3.
Comparison of alpha diversity metrics between hornet gut microbiomes. (a) Box-whisker plots of the numbers of observed OTUs, (b) Shannon diversity, and (c) Faith’s phylogenetic diversity. Points represent individual samples. Lines in the boxes correspond to the median of samples. Statistical significance was analyzed by Kruskal-Wallis test. n.s., not significant (P > 0.05). Blue, V. mandarinia; orange, V. simillima. V. mandarinia, N = 9; V. simillima, N = 8.

