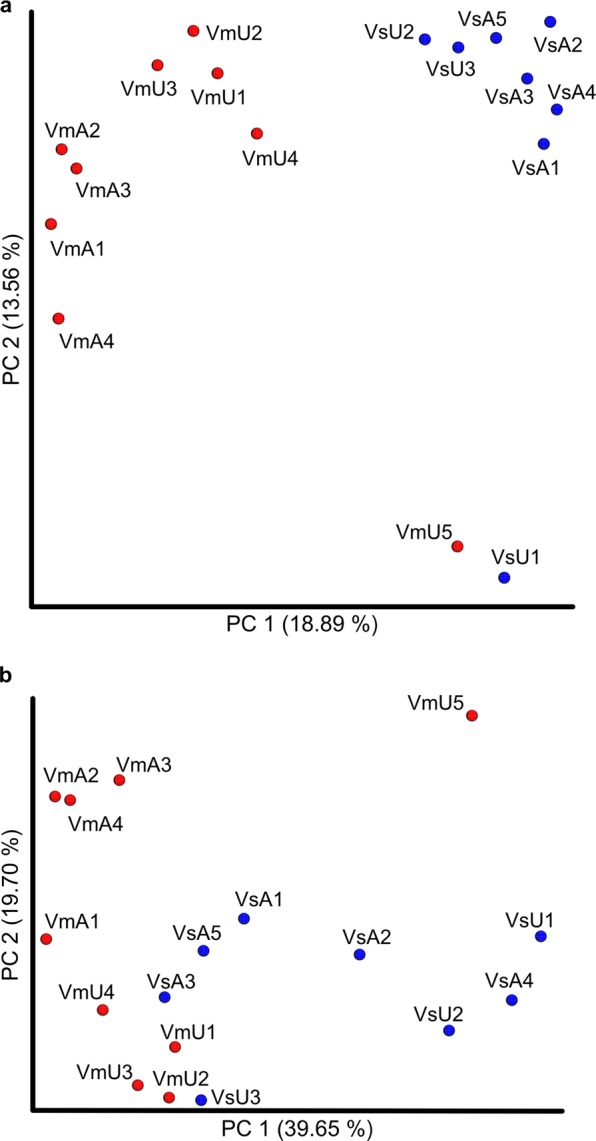
Figure 4.

PCoA analysis of hornet gut microbiome samples. (a) PCoA plots of Jaccard distance. Each point represents individual sample and clustering of points means similarity in membership of OTUs among those samples. OTU membership was significantly different between host species (P = 0.0004, ANOSIM; P = 0.0002, PERMANOVA, 5000 times of permutations in each test). (b) PCoA plots of Bray-Curtis distance. Clustering of points means similarity in relative abundances of OTUs among those samples. Relative abundances of OTUs was significantly different between species (P = 0.007, ANOSIM and PERMANOVA, 5000 times of permutations in each test). Species and sampling locations were represented by sample IDs as follows; Vm and Vs, V. mandarinia and V. simillima, respectively; A and U, AIST and UT, respectively. For instance, VmA1 means V. mandarinia AIST-1. Red, V. mandarinia; blue, V. simillima.
