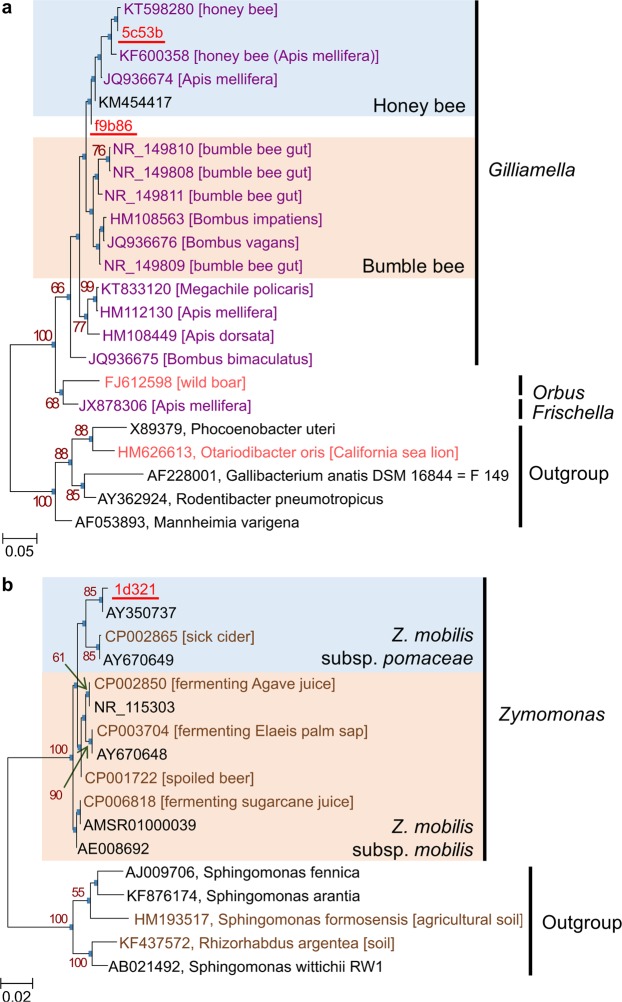
Figure 6.
Phylogenetic analysis of Gilliamella- and Zymomonas-related core OTUs in hornet guts. Maximum-likelihood trees of (a) Gilliamella and (b) Zymomonas. Phylogenetic analyses were performed with maximum-likelihood method. Bootstrap values > 50% are shown. OTUs detected in hornets are red and underlined. Isolation site or host animals, for which Genbank database in NCBI was referred, are indicated in brackets. Scale bar indicates substitutions per position. Accession numbers are colored depending on isolation sites as follows: vermilion, mammal; purple, insect; brown, others; black, not described.

