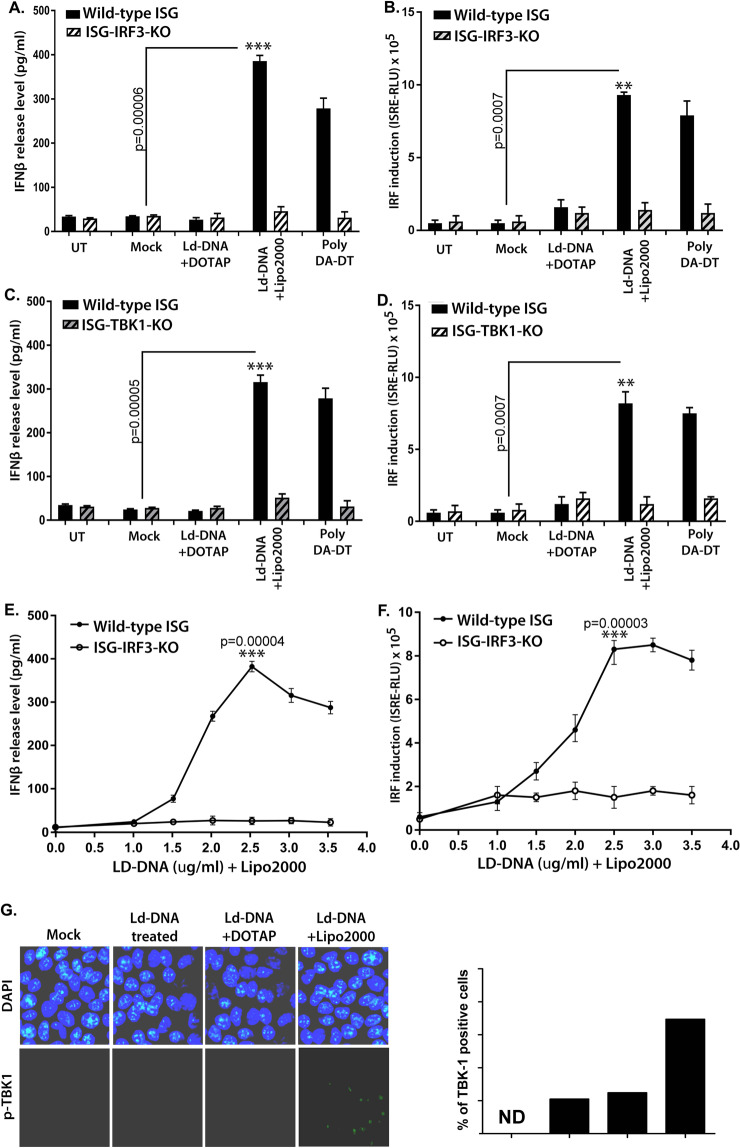
Figure 3.
Contribution of IRF3 and TBK-1 in Ld-DNA induced activation of IFN-β. (A–D) Mouse RAW264.7 ISG reporter derived IRF3 ablated [IRF3 KO] cells (A,B) or TBK-1 ablated [TBK-1 KO] cells (C,D) and control cells [ISG-WT] were mock transfected or Ld-DNA transfected [2.5 ug/ml with DOTAP or Lipofectamine 2000] or transfected with dsDNA control Poly(dA-dT) or left untreated. Production of IFN-β was estimated at the release level in the culture supernatant by ELISA (A,C) and IRF pathway activation was measured by luciferase reporter assay (B,D). (E,F) Mouse RAW264.7 reporter derived IRF3 ablated [IRF3 KO] cells and control cells [ISG-WT] were transfected with different concentrations of Ld-DNA [with Lipofectamine 2000]. Production of IFN-β was estimated at the release level in the culture supernatant by ELISA (E) and IRF pathway activation was measured by luciferase reporter assay (F). (G) Fluorescence microscopy derived images of mouse RAW264.7 cells, fixed after 8 hrs post mock transfection or Ld-DNA transfection [2.5 ug/ml with DOTAP or Lipofectamine 2000] or Ld-DNA treatment [2.5 ug/ml]. The cells were stained with anti-pTBK-1 (green) and counterstained with DAPI (blue) post fixation with PFA. Quantitative analysis of percentage of p-TBK-1 positive cells is shown as inset. All the experiments were repeated at least three times (n = 4 for A–D; and n = 3 for E–G) and the mean values are presented. Statistically significant results are marked as *p < 0.05 and ***p < 0.001.

