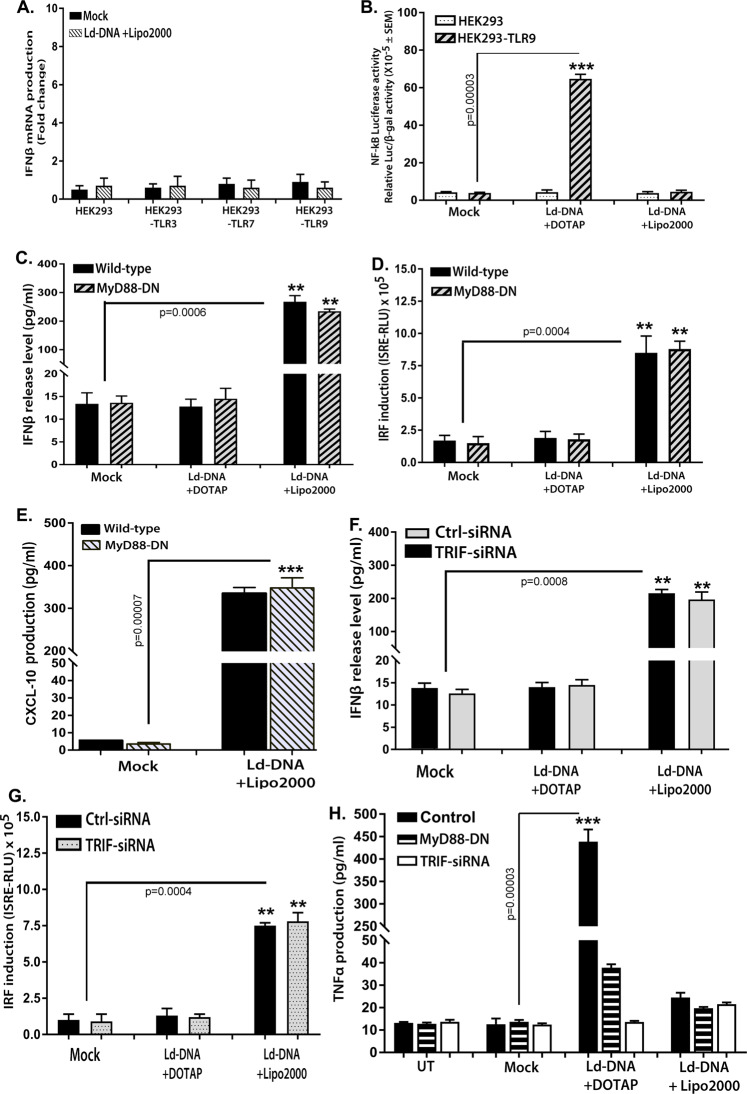
Figure 4.
Ld-DNA utilize a TLR-independent pathway for IFN-β activation. (A) HEK293 cells alone or stably expressing specific TLRs [HEK293-TLR3, HEK293-TLR7 and HEK293-TLR9] were mock transfected or Ld-DNA transfected [2.5 ug/ml with Lipofectamine 2000] and production of IFN-β was estimated at the relative transcript level by qRT-PCR. (B) HEK293 cells alone or stably expressing TLR9 [HEK293-TLR9] were transfected with NF-kB reporter luciferase plasmid or empty vector. Later, these cells were mock transfected or Ld-DNA transfected [2.5 ug/ml with DOTAP or Lipofectamine 2000]. Result represent the ratio of luciferase (Luc) to β-galactosidase (β-gal). (C–E) Mouse RAW264.7 reporter ISG derived wild type cells (WT) were either left untreated or were transfected with MyD88-DN plasmid. Later, these cells were mock transfected or Ld-DNA transfected [2.5 ug/ml with DOTAP or Lipofectamine 2000]. Production of IFN-β and CXCL-10 were estimated at the release level in the culture supernatant by ELISA (C,D) and IRF pathway activation was measured by luciferase reporter assay (E). (F–H) Mouse RAW264.7 reporter ISG derived cells were pre-transfected with targeted TRIF siRNA or non-targeted (NT) control siRNA (F–H) or transfected only with MyD88-DN plasmid (H). These cells were later mock transfected or Ld-DNA transfected [2.5 ug/ml with DOTAP or Lipofectamine 2000] or left untreated (UT). Production of IFN-β (F) and TNF-α (H) were estimated at the release level in the culture supernatant by ELISA (F,H) and IRF pathway activation was measured by luciferase reporter assay (G). Data represent mean ± SEM of at least three independent experiments (n = 4 for A–D and H; and n = 3 for E–G). Statistically significant results are marked as *p < 0.05 and ***p < 0.001.

