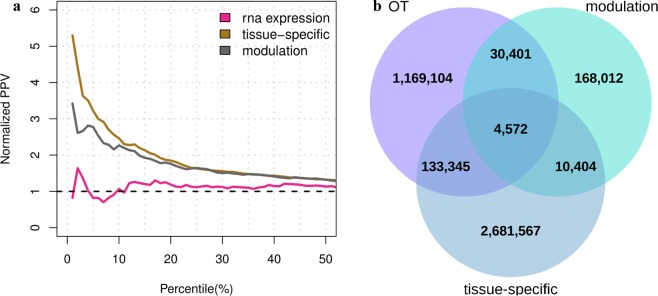
Figure 3.
Benchmark results obtained from the novel efficacy scores. (a) Ppv curves compiled on the new efficacy estimates for target-disease associations. Target-disease pairs having score greater than 0 are sorted based on the modulation and tissue-specific efficacy scores. The sorted lists are then trimmed on the 50th percentile and compared with a set of known target-disease associations in order to obtain the normalized ppv-curves. The dashed line in black indicates the normalized ppv for a random ordering of target-disease pairs. (b) Three-set Venn diagram showing the number of target-disease associations covered by the OT, modulation and tissue-specific efficacy scores.

