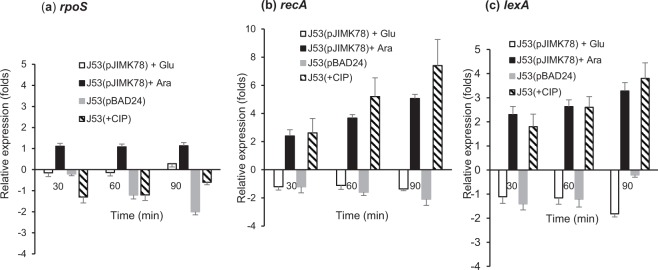
Figure 4.
Relative expression of stress response genes rpoS (a), recA (b) and lexA (c), in the presence of ParEI toxin induction or repression in E. coli J53(pJIMK78). Toxin-induced state (with 0.2% arabinose) (■), toxin-repressed state (with 0.2% glucose) (□) is compared with CIP-treated (0.25 µg/mL) cells ( ) and J53(pBAD24) vector-only control cells (
 ). Each experiment was repeated three times, and the mean values with standard deviations (error bars) are presented.

