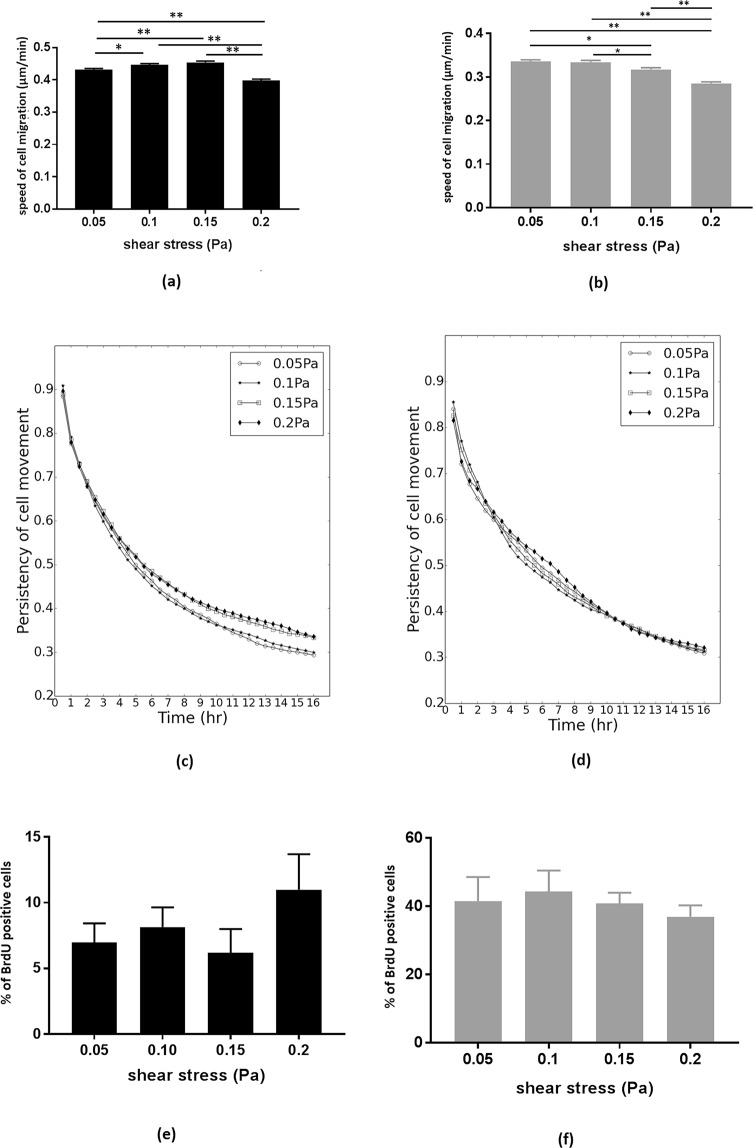
Figure 3.
Bar graphs showing the mean migration speed of HUVECs (a) and HMEC-1 (b) under shear stress of normal (0.05 Pa) and FGR conditions (0.1, 0.15 and 0.2 Pa). Error bars represent the standard error (* and ** show statistical significance, *p = 0.01, **p < 0.0001). Line graphs showing the persistency of HUVECs (no significant differences) (c) and HMEC-1 (0.05 Pa and 0.1 Pa are significantly less persistent than 0.15 and 0.2 Pa, p < 0.001) (d) under shear stress. Bar graphs showing the proportion of HUVECs (e) and HMEC-1 (f) that incorporated BrdU over a 4 hr period.

