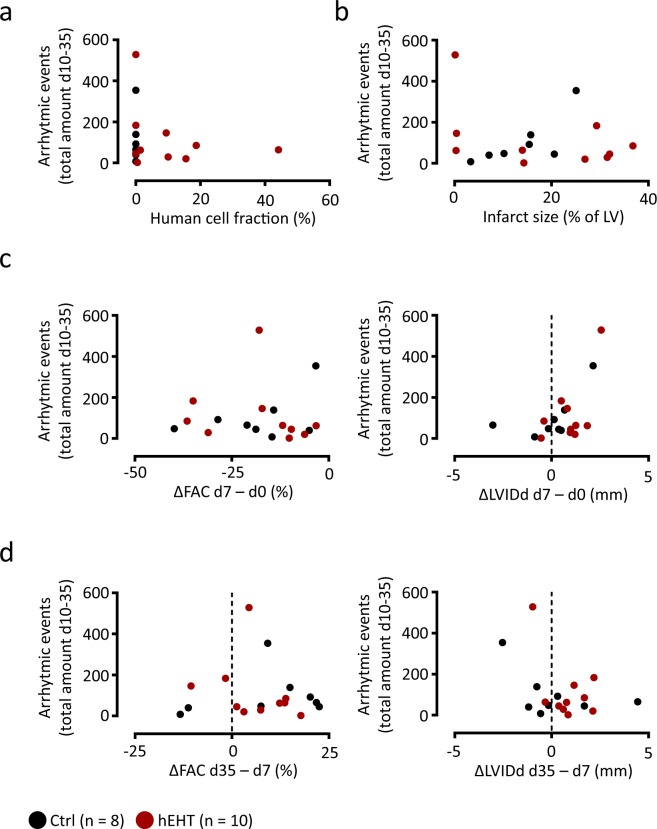
Figure 5.
Arrhythmic burden. Plots illustrating the relation between the total number of ventricular arrhythmias between day 10 and day 35 and (a) the human cell fraction, (b) the histologically confirmed infarct size, (c) the effect of the myocardial injury on fractional area change (ΔFAC day 7–day 0) and left ventricular inner diastolic diameter (ΔLVIDd day 7–day 0), and (d) the effect of the implanted grafts on FAC (ΔFAC day 35–day 7) and LVIDd (ΔLVIDd day 35–day 7). Data are calculated based on the data visualized in Figs 2 and 4.

