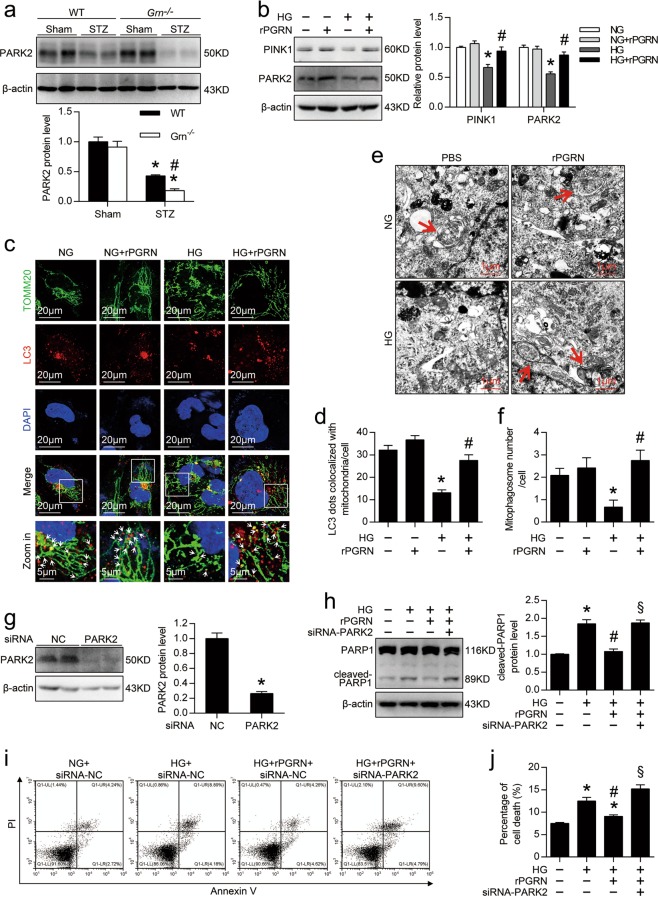
Fig. 5. PGRN rescued HG-reduced mitophagy in podocytes.
a Representative western blot gel documents and summarized data showing the protein levels of PARK2 in kidney from different groups of mice. *P < 0.05 vs. sham-operated mice, #P < 0.05 vs. WT diabetic mice (n = 6). b Representative western blot gel documents and summarized data showing the relative protein levels of PINK1 and PARK2 in podocytes with different treatments. c Representative confocal microscopic images of double immunofluorescence staining for TOMM20 (green) and LC3 (red) in podocytes with different treatments. Nuclei were revealed using DAPI staining. White arrows indicate colocalization of autophagosomes (LC3) and mitochondria (TOMM20). d Quantitative analysis of mitophagosome formation represented by colocalization of autophagosomes (LC3) and mitochondria (TOMM20). e Representative TEM images demonstrating mitophagosomes (mitophagosomes engulfing mitochondria) in podocytes with different treatments. Red arrows indicate representative mitophagosomes. f Quantification of the numbers of mitophagic vacuoles of each group. *P < 0.05 vs. NG treatment, #P < 0.05 vs. HG treatment. g Representative western blot gel documents and summarized data showing the relative protein level of PARK2 in siRNA-NC or siRNA-PARK2-transfected podocytes. *P < 0.05 vs. siRNA-NC. h Representative western blot gel documents and summarized data showing the expression levels of cleaved-PARP1 in podocytes with different treatments. i Representative flow cytometry analysis depicting the detection of apoptosis in podocytes with different treatments stained with fluorescein isothiocyanate (FITC)-conjugated Annexin V and propidium iodide (PI). j Quantitative data expressing overall percentage of cell death (annexin V-FITC-positive), including the amount of apoptotic and necrotic cells determined by flow cytometric analysis in podocytes with different treatments. *P < 0.05 vs. NG + siRNA-NC, #P < 0.05 vs. HG + siRNA-NC, §P < 0.05 vs. HG + rPGRN + siRNA-NC

