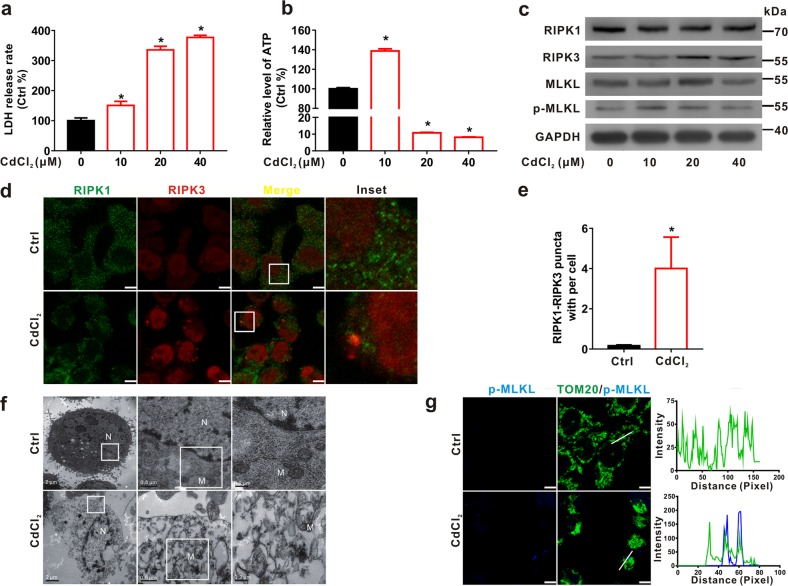
Fig. 2. CdCl2 induces necroptosis in L02 cells.
a, b L02 cells were exposed to different concentrations of CdCl2 for 6 h. a Membrane integrity was detected by LDH release assay. b ATP concentration was detected using an ATP Assay Kit. c Necroptosis-related proteins were evaluated by Western blot after L02 cells were exposed to CdCl2 with different concentrations as indicated. d, e L02 cells were treated with CdCl2 (20 μM) for 6 h. Cells were subjected to IF staining with RIPK1 antibody (green) and RIPK3 antibody (red). d The representative IF images were shown. The scale bar is 10 μm. e Quantification of RIPK1-RIPK3 puncta per cell was conducted using ImagePro-plus 6.0. f Ultrastructure of cells was observed by TEM. The scale bars are 2, 0.5, and 0.2 μm, respectively. M mitochondrion; N nucleus. g Cells were subjected to IF staining with p-MLKL antibody (blue) and TOM20 antibody (green). The profiles of representative lines trace the intensities of p-MLKL signals along with TOM20. Fluorescence curves with line intensity profile generated by Zen 2012 software were shown. The scale bar is 10 μm. Data are expressed as the mean ± standard deviation (SD). P < 0.05, *significantly different from Ctrl

