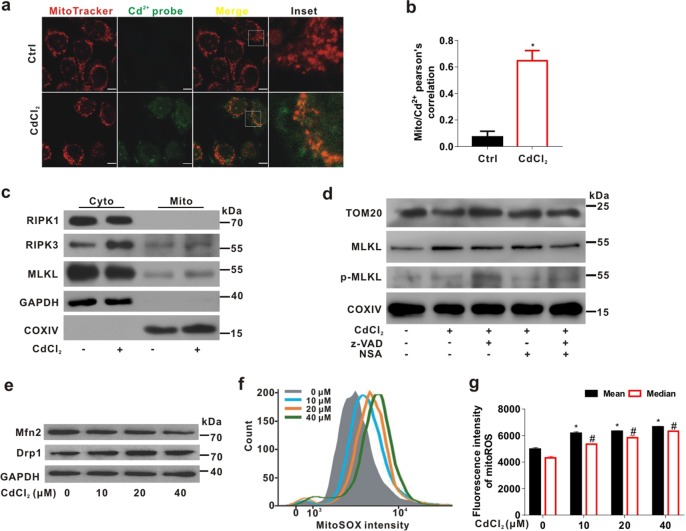
Fig. 3. Mitochondria-distributed Cd2+ induces necrosome translocation to mitochondria and MQC disorder in L02 cells.
a, b L02 cells were stained with MitoTracker Deep Red (red) and Leadmium™ Green AM Dye (Cd2+ probe; green) for mitochondria and intracellular Cd2+ and imaged using a confocal microscope. a The representative IF images were shown. The scale bar is 10 μm. b Mito/Cd2+ signal overlap of colocalization was analyzed with Pearson’s correlation using ImagePro-plus 6.0. Ten fields of view were calculated for each group. P < 0.05, *significantly different from Ctrl. c Cytoplasmic (Cyto) and mitochondrial (Mito) fractions were immunoblotted with the indicated antibodies. GAPDH or COXIV was used as loading control of cytoplasmic or mitochondrial fraction, respectively. d L02 cells were treated with CdCl2 (20 μM) and/or z-VAD (20 μM) and/or NSA (1 μM) for 6 h. Mitochondrial fractions were immunoblotted with the indicated antibodies. e L02 cells were exposed to CdCl2 (10, 20, and 40 μM) for 6 h. Mitochondrial dynamics-related proteins were immunoblotted with the indicated antibodies. f, g The mitoROS of L02 cells was detected by flow cytometry analysis after CdCl2 treatment for 6 h. f The flow cytometry images of mitoROS were shown. g Quantification of mitoROS fluorescence intensity was shown in bar charts. Data are expressed as the mean ± SD. n = 4. P < 0.05, *,#significantly different from the mean and median of Ctrl, respectively

