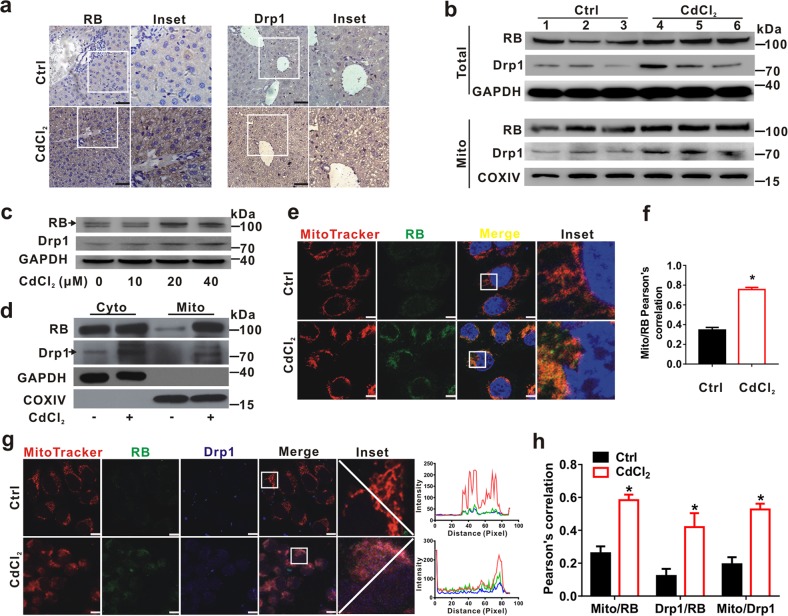
Fig. 5. CdCl2 induces RB expression and its mitochondrial translocation both in vivo and in vitro.
a, b The ICR mice were intraperitoneally injected with CdCl2 (1 mg/kg bw, n = 3) or physiological saline (Ctrl group, n = 3) for 7 days. a Liver slides were subjected to IHC using anti-RB and -Drp1 antibodies, respectively. The scale bar is 50 μm. b Whole cell lysates and mitochondrial fraction of liver tissues were prepared for Western blot with the indicated antibodies. c Western blot was applied to detect the expression levels of RB and Drp1 after CdCl2 (10, 20, and 40 μM) exposure to L02 cells for 6 h. (arrow denotes the specific band.) d Cytoplasmic (Cyto) and mitochondrial (Mito) fractions of L02 cells were prepared for Western blot to determine the expression of proteins as indicated. e–h L02 cells were treated with CdCl2 (20 μM) for 6 h. e Cells were subjected to IF staining with MitoTracker (red), anti-RB antibody (green), and DAPI (blue, staining nuclei). The scale bar is 10 μm. f Mito/RB signal overlap was analyzed with Pearson’s correlation. Red-green overlap sections were quantified by using ImagePro-plus 6.0. Ten fields of view were calculated for each group. g The images of L02 cells were labeled with MitoTracker (red) and immunostained with antibodies of anti-Drp1 (blue) and anti-RB (green). The scale bar is 10 μm. h Pearson’s correlation for the co-localization of Mito-RB, Drp1-RB, and Mito-Drp1 was shown in bar graphs quantified by using ImagePro-plus 6.0. Ten fields of view were calculated for each group. Data are expressed as the mean ± standard deviation (SD). P < 0.05, *significantly different from Ctrl

