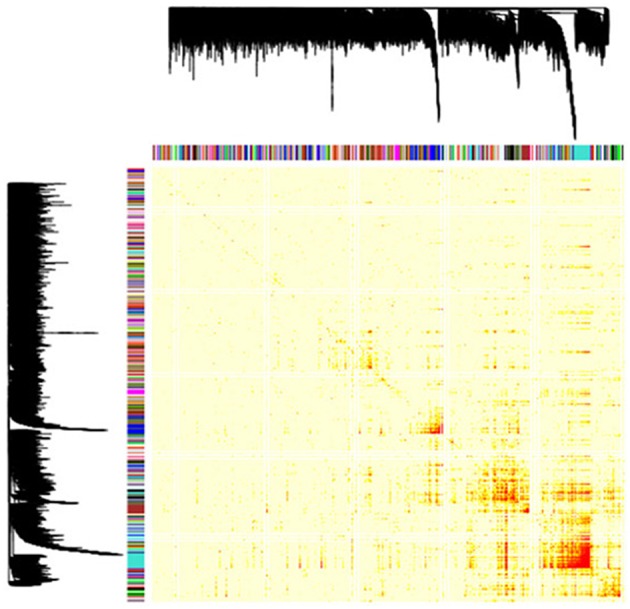
Figure 1.

Gene coexpression modules identified in the RA inflamed synovium. Dendrogram showing the 149 gene coexpression modules identified with the unsupervised hierarchical clustering approach in the genome-wide coexpression analysis. Each dendrogram branch corresponds to a gene coexpression module, as shown in the color bar below. The height of the dendrogram represents the co-expression distance among genes. The heatmap represents the adjacency matrix that was built using the pairwise gene expression correlation raised to a soft thresholding power of β = 14. The heatmap is colored according to the absolute value of the pairwise gene expression correlation, ranging from yellow (i.e., weak correlation) to red (i.e., strong correlation). The x and y axis represent the total of 18,524 genes that were included in the genome-wide coexpression analysis.
