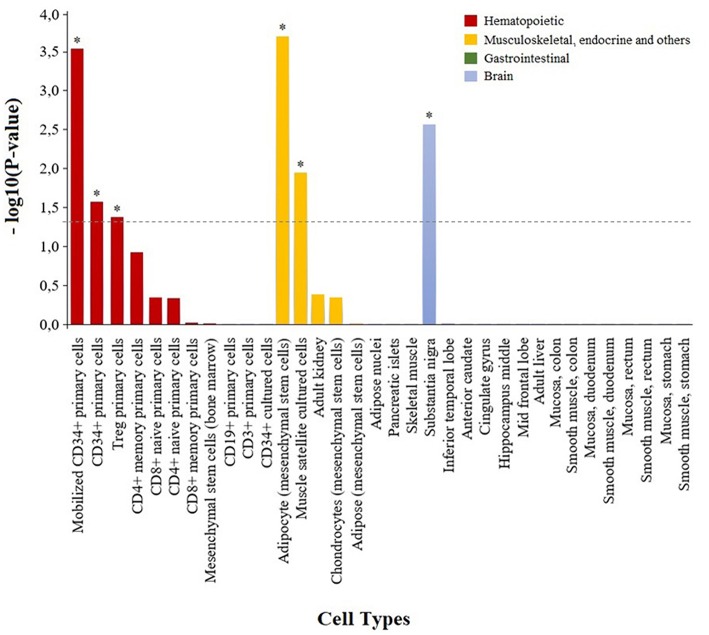
Figure 2.
Enrichment of genetic variation from the adalimumab-associated module in H3K4me3 histone marks in specific cell types. Bar plot showing the statistical significance of the adalimumab-associated genetic module and H3K4me3 histone marks from the 34 cell types analyzed. Cell types with H3K4me3 histone marks significantly enriched in adalimumab-associated variants are represented with an asterisk (P < 0.05).

