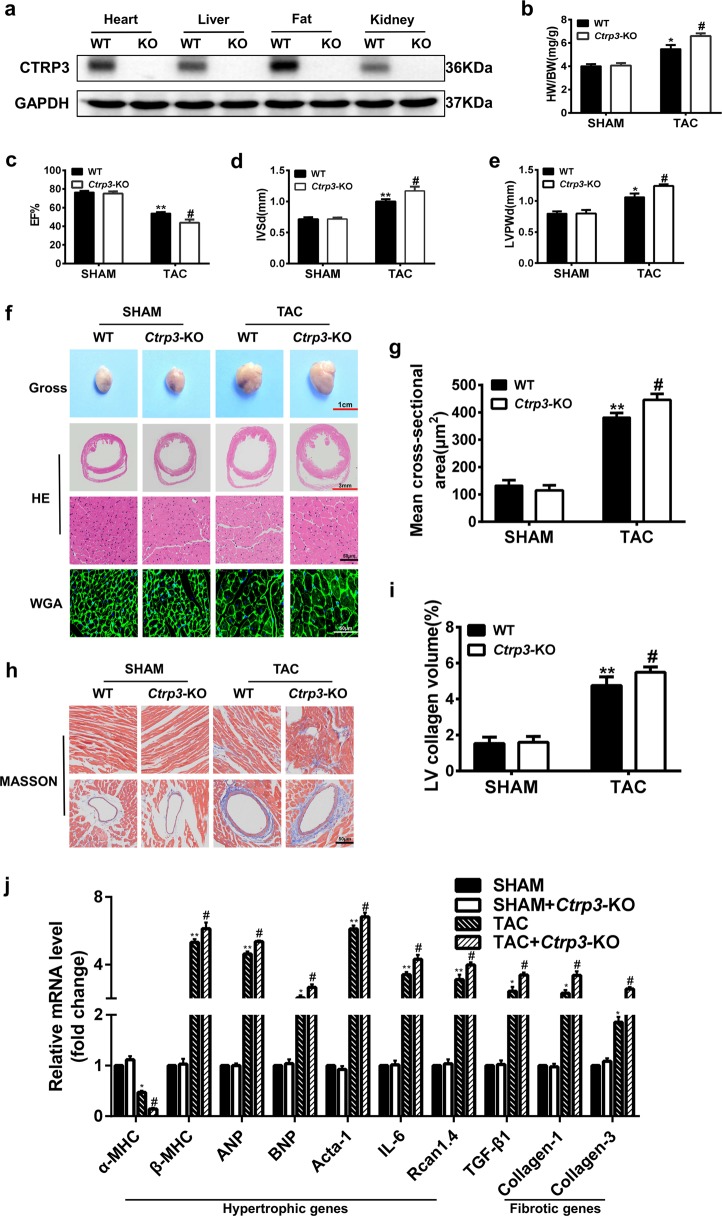
Fig. 1. CTRP3 deficiency aggravates cardiac hypertrophy induced by TAC.
a Representative western blot of CTRP3 levels in different tissues of WT mice and Ctrp3-KO mice (n = 3 mice per group). b The HW/BW ratio in animals after 4 weeks of TAC (n = 5–8 mice per group). c–e The left ventricular ejection fraction (LVEF), IVSd, and LVPWd, accordingly, determined by analyzing the echocardiographic images (n = 12–14 mice per group). f Representative images of the gross murine heart and sections stained with hematoxylin and eosin (HE), and wheat germ agglutinin (WGA) (n = 5–8 mice per group). g The mean cross-sectional area of cardiomyocytes from the indicated groups (n ≥ 100 cells per group). h Representative images of the murine heart sections (after 4 weeks of TAC) stained with Masson stain, arranged with the perivascular area at the top and the interstitial area at the bottom (n = 5–8 mice per group). i The LV collagen volume in different groups (n ≥ 40 fields per group). j Real-time polymerase chain reaction (real-time PCR) analysis of the expression of genes encoding hypertrophic markers α-MHC, β-MHC, ANP, BNP, Acta-1, IL-6, and Rcan1.4, and the fibrotic markers TGF-β1, collagen-I, and collagen-III in each group (n = 6 mice per group). b–j The data were analyzed by one-way ANOVA. **p < 0.01 vs. SHAM, #p < 0.05 vs. TAC. In the bar graphs, the data are presented as the mean ± standard error of the mean (SEM)

