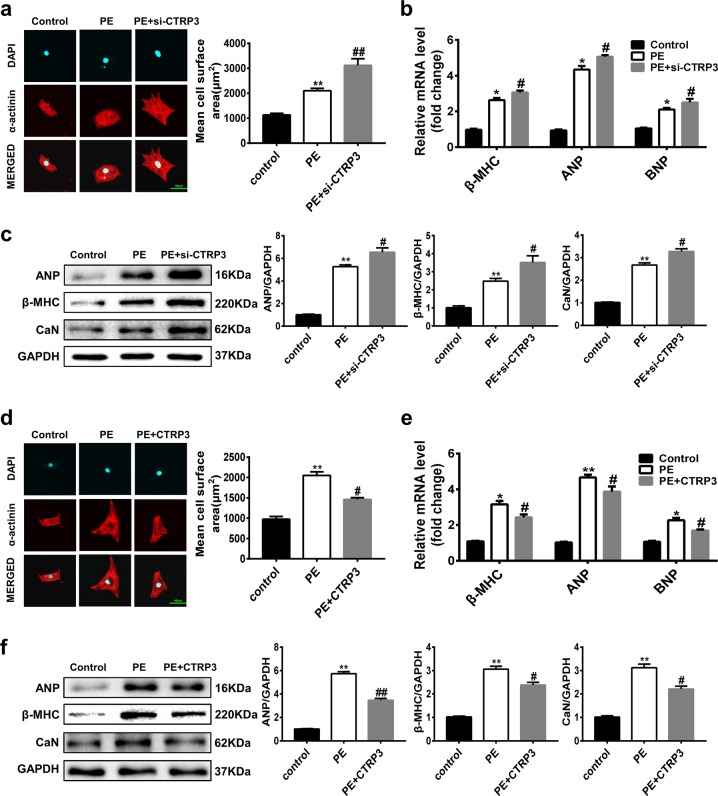
Fig. 3. CTRP3 alters PE-induced cardiomyocyte hypertrophy in NRCMS.
a Left: Representative immunofluorescence images of the NRCMs stained by α-actinin (red) and 4′,6-diamidino-2-phenylindole (DAPI; blue) observed under a confocal microscope. Right: The mean cell surface area of NRCMs from the indicated groups (n ≥ 30 cells per group). b Real-time PCR analysis of the expression of genes encoding the hypertrophic markers β-MHC, ANP, and BNP in the indicated groups (n = 5 samples per group). c Representative western blot (left), and quantification (right) of β-MHC, ANP and CaN levels in the indicated groups (n = 5 samples per group). d Left: Representative immunofluorescence images of the NRCMs stained by α-actinin (red) and DAPI (blue), observed under a confocal microscope. Right: The mean cell surface area of NRCMs from the indicated groups (n ≥ 30 cells per group). e Real-time RT-PCR analysis of the expression of genes encoding the hypertrophic markers β-MHC, ANP, and BNP in the indicated groups (n = 5 samples per group). f Representative western blot (left), and quantification (right) of β-MHC, ANP and CaN levels in the indicated groups (n = 5 samples per group). The data were analyzed by one-way ANOVA. *p < 0.05, **p < 0.01 vs. control, #p < 0.05 vs. PE. In the bar graphs, the data are presented as the mean ± SEM

