Figure 1.
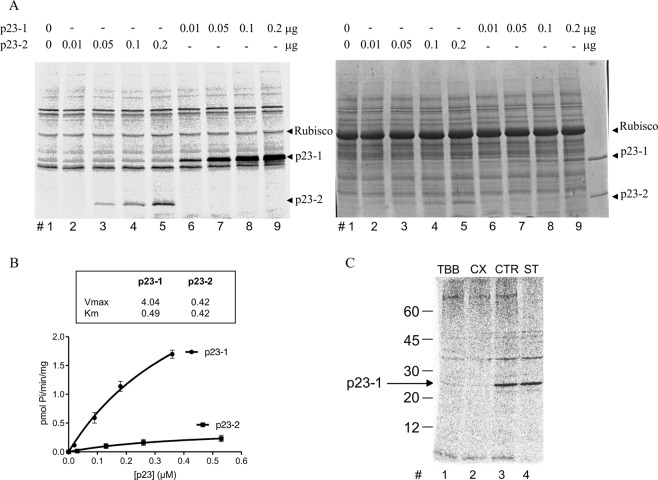
p23-1 phosphorylation by CK2-like activity. (A) Representative autoradiography (left) and Coomassie staining (right) after radioactive phosphorylation of increasing concentrations of recombinant p23-1 and p23-2, as indicated, by 10 μg of Arabidopsis total protein extract and separation via SDS-PAGE. The arrows indicate the migrations of each p23 isoform. Equally labeled radioactive bands in all lanes are due to autophosphorylation of the proteins present in the extract (see lane 1, where no p23 was present). The migration of the most abundant protein rubisco (~55 kDa) is also indicated. (B) Kinetics showing phosphorylation by CK2 with increasing concentrations of p23-1 and p23-2. The calculated kinetics values are shown in the box. Vmax is reported as pmol/min/mg, Km as μM. Quantification was performed by excising bands from the gel, as shown in panel A, and scintillator counting. Values are the means ± SD of independent experiments. (C) p23-1 (0.1 μg) was phosphorylated by 10 μg of Arabidopsis total protein extract in the presence (as indicated) of 2 μM TBB (TBB), 10 nM CX4945 (CX), or 1 μM Staurosporin (ST), or DMSO solvent as the control (CTR). Representative autoradiography is shown after protein separation by SDS-PAGE. The arrow indicates the migration of p23-1. Mw markers migrations are also shown on the left.

