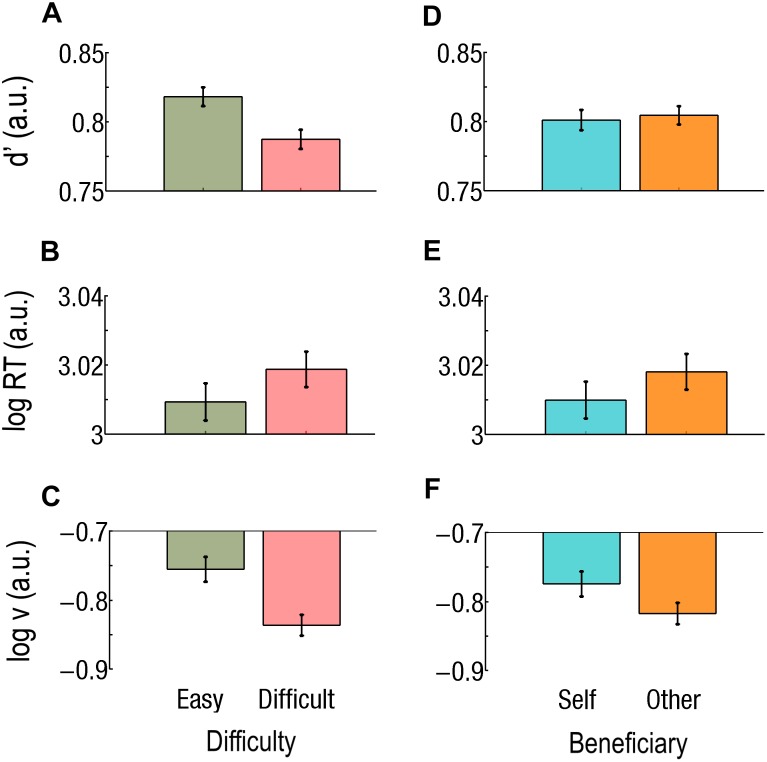
FIGURE 3.
(A–C) Main effect of difficulty. Easy trials are green and on the left, Difficult trials are red and on the right. (A) Sensitivity (d’) is worse, (B) reaction times (RTs) are longer, and (C) drift rate (v) is lower during Difficult trials than during Easy trials. (D–F) Main effects of beneficiary. Self-affecting trials are cyan and on the left; other-affecting trials are orange and on the right. (D) Sensitivity did not differ but there was (E) a faster RT and (F) a higher drift rate (v) for Self than for Others. Log RT, d’, and log v are expressed in arbitrary units (a.u.). Bars represent the standard errors of the mean (SEM).

