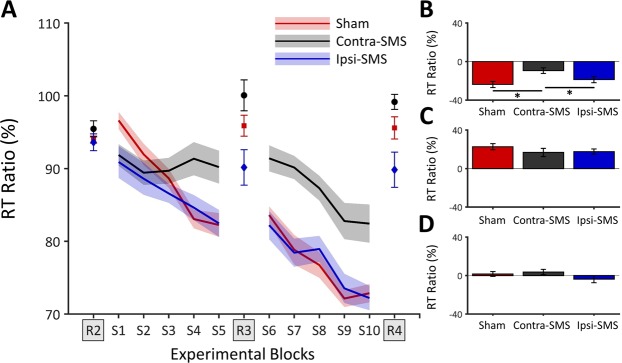
Figure 1.
Results of the first SRTT session. (A) Mean RT ratio data for each group as a function of experimental block during the first session. The R1 block was used to normalize RT data into ratio. (B) Global learning (S10-S1) RT ratio data. The Contra-SMS group showed impaired global learning as compared to the two other groups, which did not differ. (C) Specific learning (R4-S10) RT ratio data. (D) Unspecific learning (R4-R2) RT ratio data. Error bars represent SEM. Asterisks (*) denote significant differences (p < 0.05).

