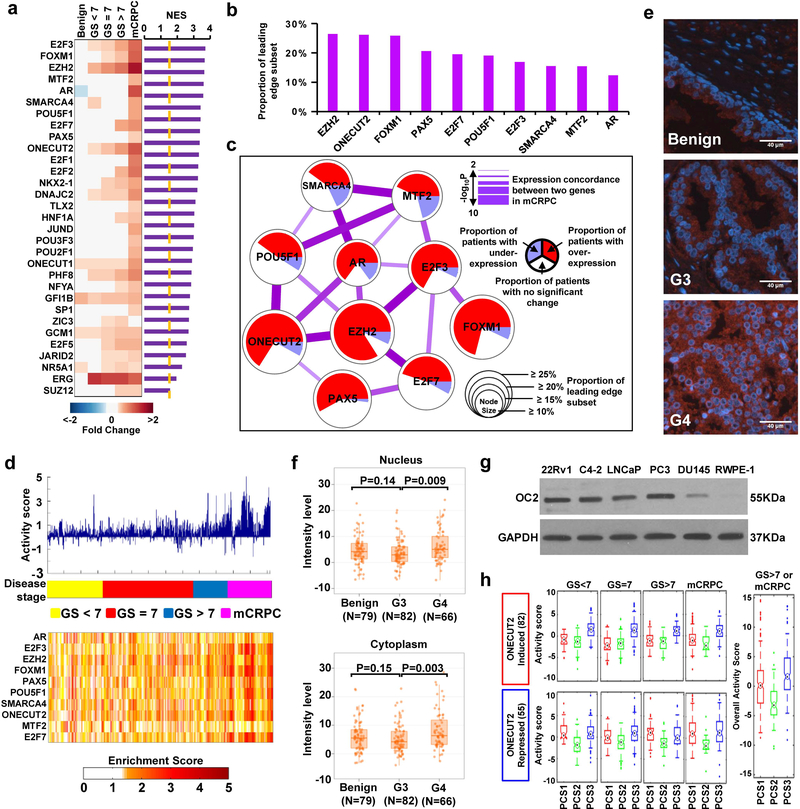
Figure 1. OC2 is predicted to be active in mCRPC.
(a) Up-regulated TFs in mCRPC in the DISC cohort. The heatmap displays TF expression level in 5 disease categories. GS = Gleason sum score. Purple bars represent normalized enrichment score (NES), a statistical measure of TF activity. (Benign N=794, GS<7 N=328, GS=7 N=530, GS>7 N=203, mCRPC N=260).
(b) Ranking of the 10 most active TFs (from Fig. 1a) in mCRPC from the DISC cohort.
(c) A network model describing activity and association of highly active TFs in mCRPC. TFs are identified as nodes. Node size = activity. Node color = proportion of patients where the TF is up- or down-regulated, or unchanged. Edges = degree of interaction. Edge thickness = concordance in RNA expression.
(d) The bar plot (top) displays summary of TF activation across disease categories. The heatmap (bottom) shows activation of individual TFs across disease categories.
(e and f) Representative images and quantitation of OC2 expression (red) in benign (N=79), Gleason Grade 3 (G3, N=82) and Gleason Grade 4 (G4, N=66) PC tissues. Tissue sections are stained using a fluorescent antibody detection system and nuclei visualized with DAPI (blue). Scale bar 40μm. The boxes show the 25th-75th percentile range and the center line is the median. Whiskers show 1.5 times the inter-quartile range (IQR) from the 25th or 75th percentile values. P values obtained from Wilcoxon two-tailed rank-sum test.
(g) Immunoblot showing endogenous OC2 levels in prostate cell lines. Representative blots from two independent experiments. Full-length blots are presented in Supplementary Fig. 8.
(h) Inferred activity of OC2 in PCS1–3 subtypes12 plotted by disease category. Upper and lower panels show inducible and repressive activity of OC2, respectively. Right panel shows overall OC2 activity in GS>7 and mCRPC tumors. Red= PCS1, green=PCS2, blue=PCS3. The boxes show the 25th-75th percentile range and the center mark is the median. Whiskers show 1.5 times IQR from the 25th or 75th percentile values. Data points beyond the whiskers are displayed using dots. (GS<7 & PCS1, N=28; GS<7 & PCS2, N=158; GS<7 & PCS3, N=142; GS=7 & PCS1, N=98; GS=7 & PCS2, N=201; GS=7 & PCS3, N=231; GS>7 & PCS1, N=79; GS>7 & PCS2, N=52; GS>7 & PCS3, N=72; mCRPC & PCS1, N=172; mCRPC & PCS2, N=17; mCRPC & PCS3, N=71; GS>7 or mCRPC & PCS1, N=251; GS>7 or mCRPC & PCS2, N=69; GS>7 or mCRPC & PCS3, N=143).

