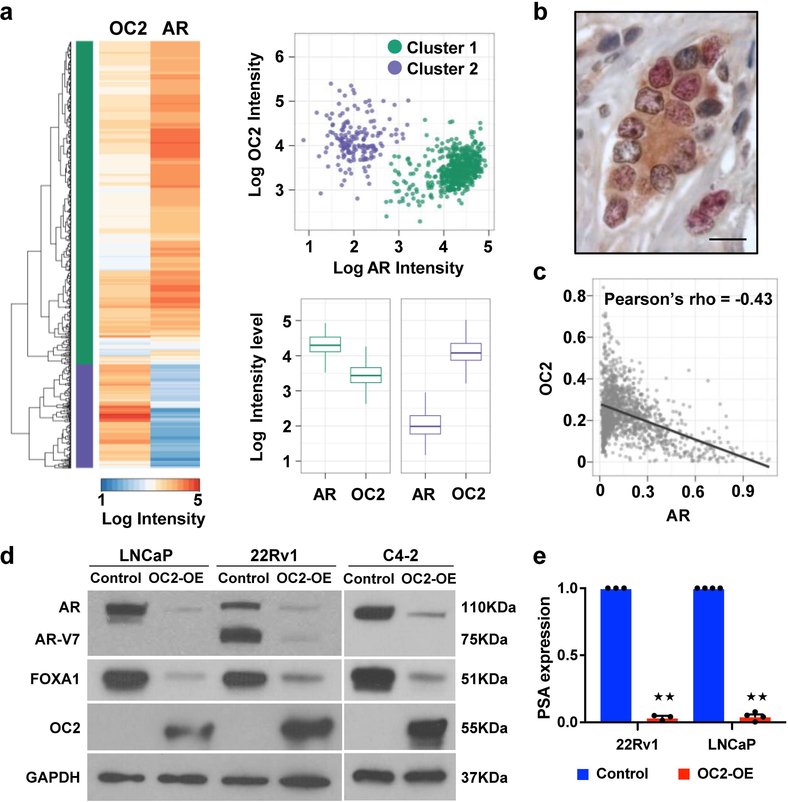
Figure 2. Inverse relationship between OC2 and AR nuclear localization in radical prostatectomy specimens.
(a) Multiplex IF staining with anti-OC2 and anti-AR antibodies in 6 cases of high-grade PC. Heatmap and dendrogram of nuclear staining intensities of AR and OC2, using the Euclidean distance and complete linkage method in an unsupervised cluster analysis, identifies two cell populations: AR high/OC2 low and AR low/OC2 high. Scatter plot of individual nuclei separated by intensity levels of AR and OC2. Cluster 1 (C1, green) represents high AR/low OC2 cells (N=1,109) and cluster 2 (C2, purple) represents low AR/high OC2 cells (N=199). Boxplots of intensity levels of nuclear AR and OC2 in C1 (left) or C2 (right). The boxes show the 25th-75th percentile range and the center line is the median. Whiskers show 1.5 times the IQR from the 25th or 75th percentile values. Left boxplot: P=2.1×10−191, right boxplot: P=2.3×10−66, Wilcoxon two-tailed rank-sum test.
(b) Representative IHC image of OC2 and AR in high-grade PC. OC2=red, AR=brown. Scale bar 20μm.
(c) Scatter plot of AR and OC2 nuclear intensity from 35 TMA cores of high-grade PC. Each dot represents one nucleus (N=1,373). Pearson’s method, P=4.8×10−64.
(d) AR and FOXA1 protein in PC cell lines after enforced expression of OC2. Representative blots from two independent experiments. Full-length blots are presented in Supplementary Fig. 8.
(e) PSA mRNA expression after enforced expression of OC2. The mean + S.E.M. from three to four independent experiments is shown. Unpaired two-tailed Student´s t-test, for 22Rv1 ★★P=8.73×10⁻⁸; for LNCaP ★★P=1.11×10⁻⁹.

