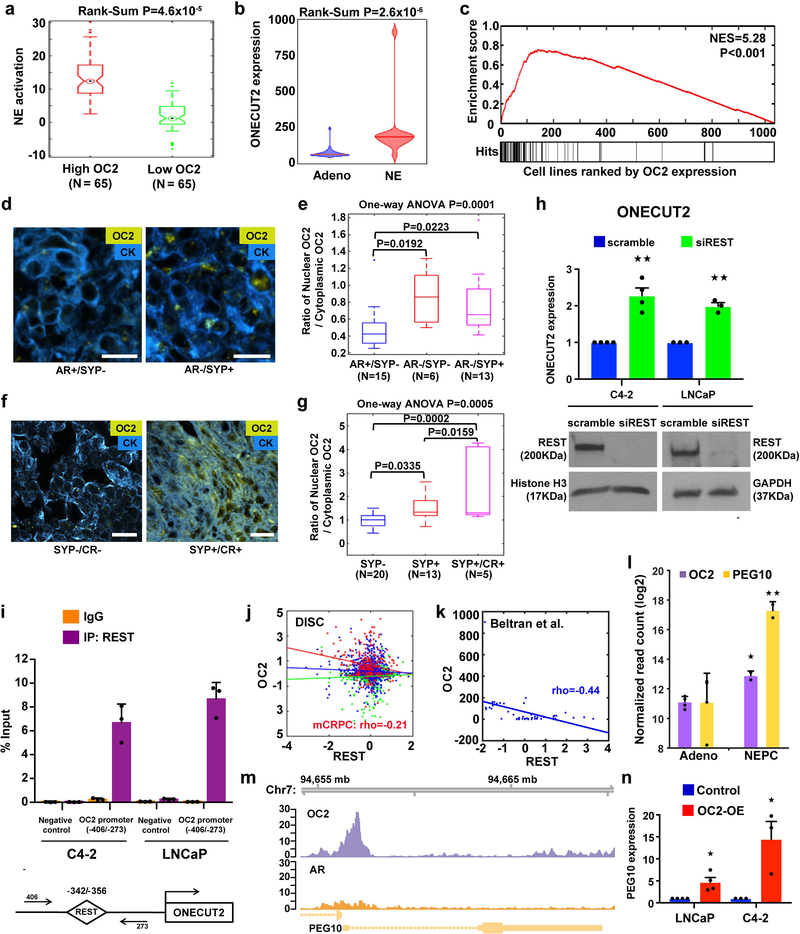
Figure 4. OC2 activates a lethal transcriptional program.
(a) NE activation score in mCRPC tumors with high (N=65) and low (N=65) OC2 expression (top and bottom quartiles) from the DISC cohort. The boxes show the 25th-75th percentile range and the center line is the median. Whiskers show 1.5 times the IQR from the 25th or 75th percentile values. Data points beyond the whiskers are displayed using dots. Wilcoxon two-tailed rank-sum test, P=4.6×10⁻⁵.
(b) Violin plot of OC2 gene expression in a CRPC cohort from Beltran et al.26. Wilcoxon two-tailed rank-sum test was performed to compare NE tumors (N=15) and adenocarcinoma (Adeno, N=34). Distribution of OC2 expression shown by kernel density. The horizontal line within the violin represents the median. Wilcoxon two-tailed rank-sum test, P=2.6×10⁻⁶.
(c) The enrichment plot depicts sample-wise enrichment of the set of cancer cell lines (N=1,063) in the CCLE with NE or neural properties, sorted by OC2 expression.
(d and e) Representative images and quantitation of OC2 expression in mCRPC specimens annotated for AR and synaptophysin (SYP) expression status. IF detection of OC2 (gold) and cytokeratin (blue). AR-positive/SYP-negative (AR+/SYP-) N=15, AR/SYP-N=6 and AR-/SYP+ N=13. Scale bar 20μm.
(f and g) Representative images and quantitation of OC2 expression in LuCaP human PC xenografts annotated for SYP expression and castration resistance (CR): SYP-N=20, SYP+ N=13 and SYP+/CR+ N=5. Scale bar 20μm.
For (e) and (g) the ratio of nuclear OC2 to cytoplasmic OC2 is shown on the Y-axis and cytoplasm was defined by a cytokeratin mask. The boxes show the 25th-75th percentile range and the center line is the median. Whiskers show 1.5 times the IQR from the 25th or 75th percentile values.
(h) OC2 mRNA levels in C4–2 and LNCaP cell lines after depletion of REST. The mean + S.E.M. from three to four independent experiments is shown. Unpaired two-tailed Student´s t-test, for C4–2★★P=0.002; for LNCaP ★★P=0.001.
(i) REST binding to the OC2 promoter. Data show mean + S.D. from triplicates. Results are representative of two independent experiments.
(j) Correlation of OC2 and REST expression levels in the DISC cohort. No significant correlation was observed in benign (green, N=673) and primary (blue, N=1,061) tumors, while mCRPC tumors (red, N=260) show significant inverse correlation between OC2 and REST. Colored lines represent regression lines of the respective data points. Pearson’s method, P=0.001.
(k) Inverse relationship of OC2 and REST expression, from Beltran et al.26. Regression line in blue. Pearson’s method, P=2.9×10−36.
(l) OC2 and PEG10 mRNA expression with NE transdifferentiation in the LTL331 model35. (Adeno N=4, NEPC N=2). Unpaired two-tailed Student´s t-test followed by Storey’s FDR correction method, ★FDR=0.031, ★★ FDR=0.005.
(m) Genome browser view of endogenous OC2 binding to the PEG10 promoter in 22Rv1 cells. The result shown is representative of the two biologically independent ChIP-seq experiments performed.
(n) PEG10 mRNA expression after enforced expression of OC2. The mean + S.E.M. from three to four independent experiments is shown. Unpaired two-tailed Student´s t-test, LNCaP★P=0.012, C4–2 ★P=0.029.

