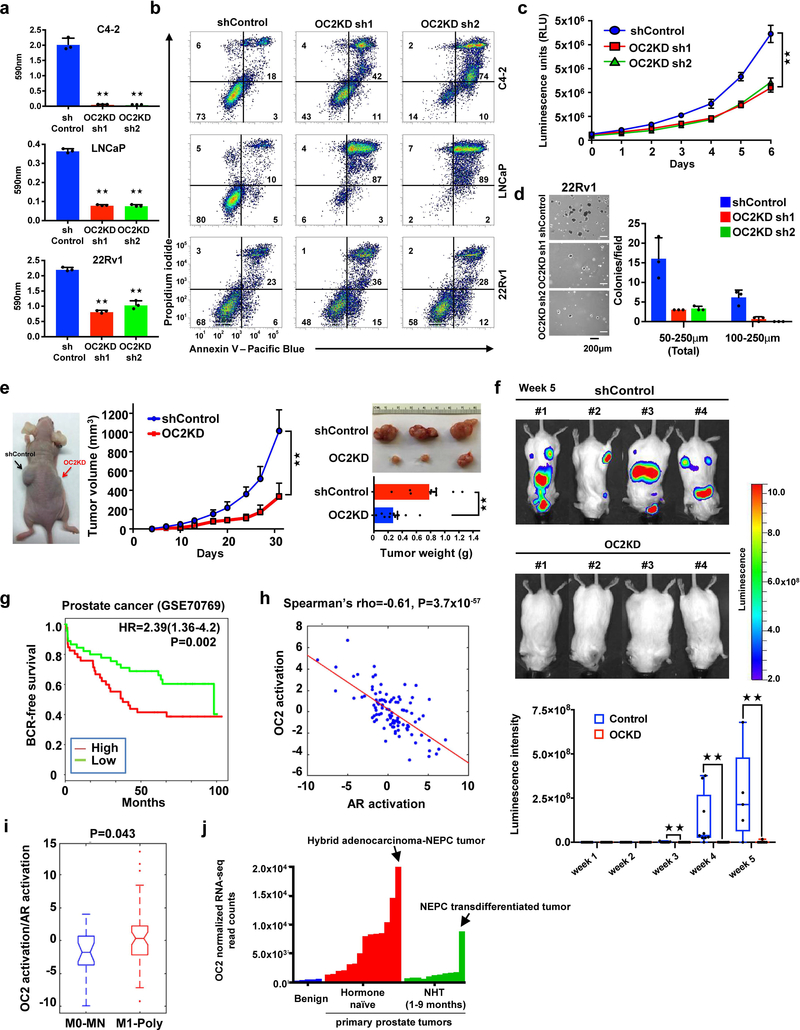
Figure 5. OC2 promotes mCRPC tumor growth and metastasis.
(a) Cell survival 4 days after start of OC2 depletion. The mean + S.D. from three independent experiments is shown. Unpaired two-tailed Student´s t-test, C4–2: sh1★★P= 7.58×10⁻⁵, sh2★★P= 7.48×10⁻⁵; LNCaP: sh1★★P=1.57×10⁻⁶, sh2★★P=2.03×10⁻⁶, 22Rv1: sh1★★P=5.42×10⁻⁶, sh2★★P= 0.0002.
(b) OC2 depletion results in cell death 4 days after infection, measured by flow cytometry and double staining with Annexin V-FITC and propidium iodide (PI). These experiments were repeated independently three times with similar results.
(c) Growth in cell culture of 22Rv1 cells after OC2 depletion. The mean +/− S.D. from three independent experiments is shown. Unpaired two-tailed Student´s t-test, sh1★★ P=0.0006, sh2★★P=0.0009.
(d) Growth in soft agar of 22Rv1 cells after OC2 depletion. The mean + S.D. from triplicates is shown. The result shown is representative of two independent experiments.
(e) Subcutaneous 22Rv1 tumor growth after OC2 depletion (left). Appearance of tumors after 31 d (top right). Tumor volume (middle) and weight (bottom right) are shown as mean + S.D. (N=10 per mice group). Unpaired two-tailed Student´s t-test, tumor volume ★★P=0.005, tumor weight ★★P=0.0002.
(f) Effect of OC2 silencing on 22Rv1 metastasis following intracardiac injection. Bioluminescence images of mice bearing metastatic tumors 5 weeks after injection (top) and graphical representation of normalized bioluminescence signals of tumor development (bottom). N=9 mice per group. The boxes show the 25th-75th percentile range and the center line is the median. Whiskers include the smallest and largest values. Wilcoxon two-tailed rank-sum test, in week 3 ★★P= 0.023, in week 4 ★★P= 0.009, in week 5 ★★P=0.0017.
(g) Association of BCR-free survival with OC2 expression. High (N=46) and low (N=45). Cox proportional hazard regression, two-sided test, P=0.002.
(h) Inverse correlation between OC2 activation and AR activation based upon mRNA expression in tumor foci of diagnostic prostate needle biopsies (N=99). Spearman’s rank correlation test, P=3.7×10−57.
(i) Ratio of OC2 activation to AR activation in diagnostic prostate needle biopsies (M0-MN (N=23) and M1-Poly (N=52)). M1-Poly = patients with concurrent polymetastases (>5 bone or extrapelvic lymph node metastases and/or visceral metastases) at the time of diagnostic biopsy. M0-NM = high-grade prostate tumor biopsies from patients that remained locally confined (no metastatic progression) with average follow-up of 56 months. The boxes show the 25th-75th percentile range and the center line is the median. Whiskers show 1.5 times the IQR from the 25th or 75th percentile values. Data points beyond the whiskers are displayed using dots. Wilcoxon two-tailed rank-sum test, P=0.043.
(j) Expression of OC2 mRNA in benign and high risk primary prostate tumors from Wyatt et al.37. NHT= neo-adjuvant hormone therapy.

