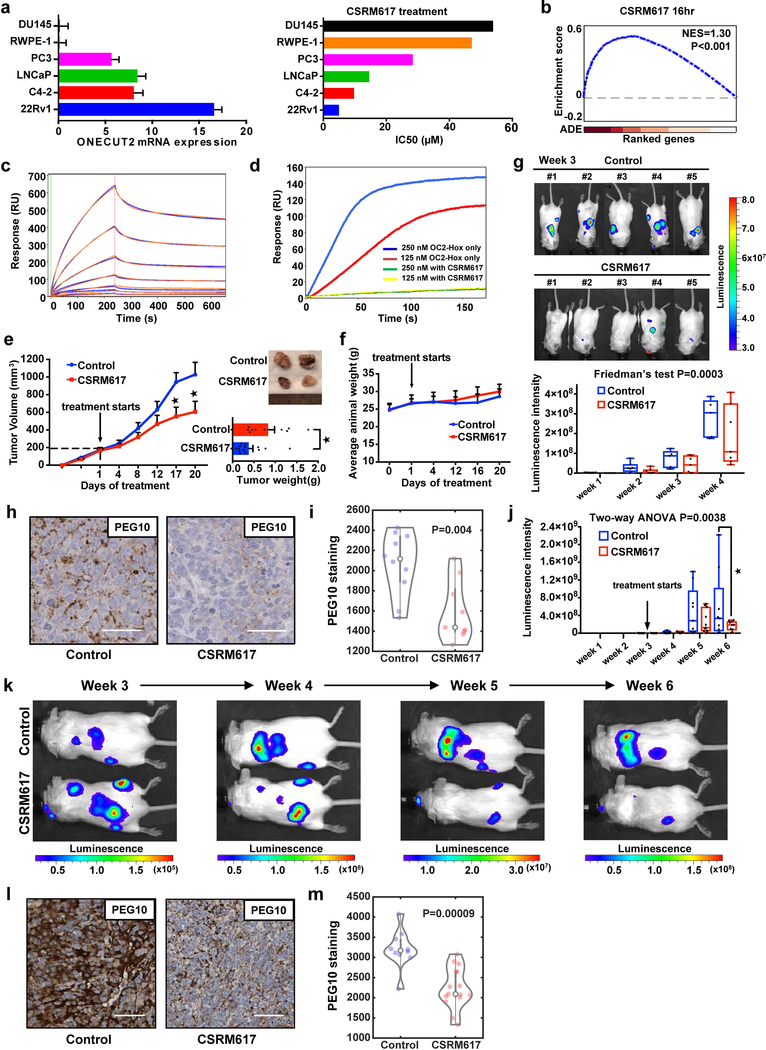
Figure 6. Inhibition of OC2 with a small molecule.
(a) Relative OC2 mRNA levels in 6 prostate cell lines determined by RT-qPCR (left). ACTB and GAPDH expression levels were used for normalization. Data show mean + S.D. from triplicates. Results are representative of two independent experiments. The IC50 values for compound CSRM617 shown are the mean from two independent experiments (right).
(b) Enrichment plot of OC2 target genes perturbed by 10μM CSRM617 at 16 h in 22Rv1 cells. ADE = Absolute differential expression (N=3 independent microarray experiments).
(c) Dose-dependent binding of CSRM617 (1.56μM to 100μM) to OC2-HOX is shown in blue. 2:2 Langmuir model simulation used to derive kinetic parameters of the bimolecular interactions shown in orange.
(d) SPR competition assay showing compound CSRM617 (100μM) inhibiting OC2-HOX binding to DNA at two different concentrations protein 250nM (blue) and 125nM (red). For (c) and (d) these experiments were repeated independently three times with similar results.
(e) 22Rv1 cells were implanted subcutaneously. When tumors reached 200mm3, mice were randomized and received vehicle or 50 mg/Kg CSRM617 daily (Control N=11 tumors, CSRM617 N=14). Appearance of tumors after 20 d (top right). Tumor volume (left) and tumor weight (bottom right) are shown as mean + S.E.M. (Unpaired two-tailed Student´s t-test, tumor volume 1st★P=0.02, 2nd★P=0.037, tumor weight ★P=0.011).
(f) CSRM617 treatment did not affect animal weight (mice from (Fig. 6e)). Mean ± S.D. is shown (N=8 mice per group).
(g) 22Rv1-luciferase labeled cells were injected intracardially; two days after injection mice were randomized (N=7 per group) to receive vehicle or 50 mg/Kg CSRM617 daily. Bioluminescence images (BLI) of mice bearing metastatic tumors 3 w after the injection (top) and graphical representation of normalized BLI signals, weeks 1–4 (bottom). The boxes show the 25th-75th percentile range and the center line is the median. Whiskers include the smallest and largest values. Friedman’s two-tailed test, P=0.0003.
(h and i) Representative PEG10 IHC staining and quantification in adrenal metastases from the experiment in Fig. 6g. Scale bar 50μm. Control (N=10 microscope fields) and CSRM617 (N=9). Kernel density estimation shows the distribution of PEG10 staining. The open circle indicates the median. The thick and thin vertical grey lines represent the IQR and 95% confidence interval, respectively. Wilcoxon two-tailed rank-sum test, P=0.004.
(j) 22Rv1-luciferase labeled cells were injected intracardially. Once metastases were established, mice were randomized (N=11 per group) to receive vehicle or 50 mg/Kg CSRM617 daily. Graphical representation of normalized BLI signals of mice bearing metastatic tumors 6 weeks after the injection. The boxes show the 25th-75th percentile range and the center line is the median. Whiskers include the smallest and largest values. Two-way ANOVA (P=0.0038), followed by post-hoc Dunnett’s test at week 6 (★P=0.0158).
(k) Representative result from (Fig. 6j) showing one control and one treated subject with CSRM617 in weeks 3 to 6.
(l and m) Representative PEG10 IHC staining and quantification in adrenal metastases from the experiment in Fig. 6j. Scale bar 50μm. Control (N=10 microscope fields) and CSRM617 (N=15). Kernel density estimation shows the distribution of PEG10 staining. The open circle indicates the median. The thick and thin vertical grey lines represent the IQR and 95% confidence interval, respectively. Wilcoxon two-tailed rank-sum test, P=9×10⁻⁵.

