Supplementary Fig. 7.

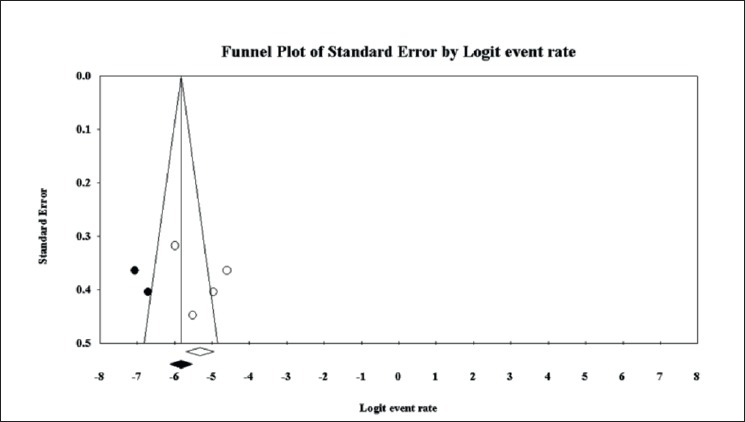
Funnel plot of cannabis use prevalence based on saliva samples. showing evidence of publication bias. In white observed effect sizes, in black imputed effect sizes.

Funnel plot of cannabis use prevalence based on saliva samples. showing evidence of publication bias. In white observed effect sizes, in black imputed effect sizes.