Figure 1.

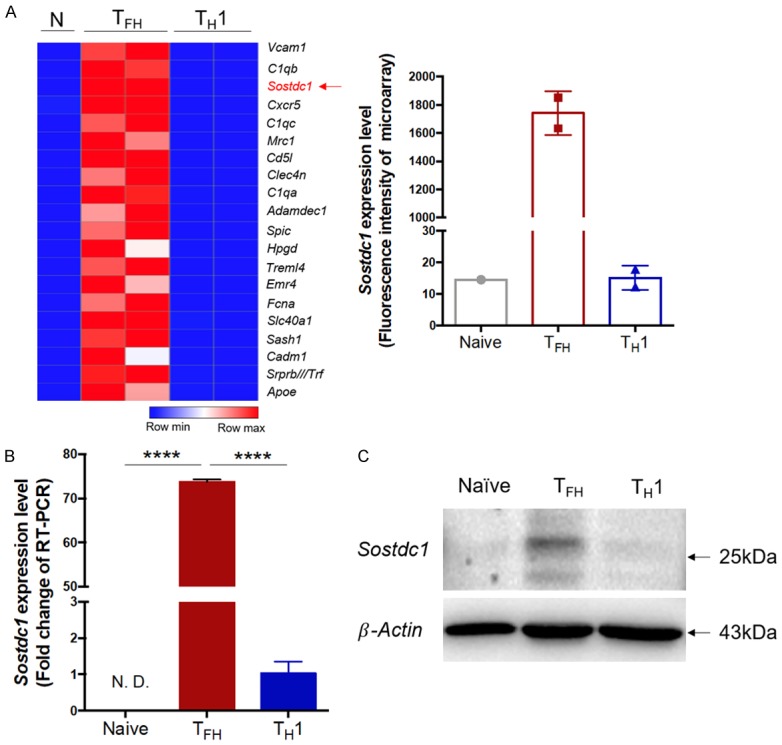
SOSTDC1 expression is abundant in TFH cells but not in TH1 cells or naïve CD4+ T cells. Naïve SMARTA (CD45.1+) cells were transferred into C57BL/6J (CD45.2+) mice followed by LCMV Armstrong infection the next day. On day 8 after infection, CD45.1+ TFH (CD4+CD44+SLAM-CXCR5+) and TH1 (CD4+CD44+SLAM+CXCR5-) cells were sorted and analysed with naïve SMARTA cells (CD4+CD62L+CD44-). A. Heat map of the top 20 genes with higher expression in TFH cells than in TH1 cells and naïve cells (left). The fluorescence intensity of the Sostdc1 probe in TFH, TH1 and naïve cells (right) from previous microarray data from our laboratory (GEO accession code GSE65693). B. Quantitative RT-PCR analysis of Sostdc1 gene expression in TFH cells and TH1 cells in the spleen of wild-type (CD45.2+) mice adoptively transferred with SMARTA cells (CD45.1+) on day 8 post infection with LCMV Armstrong and in naïve CD4+ T cells (CD62L+CD44-). C. Immunoblot analysis of SOSTDC1 and β-actin (loading control) expression in naïve, TFH and TH1 cells. N. D., not detected. ****P < 0.0001 (unpaired two-tailed t-test; the error bars in A and B indicate the standard errors).
