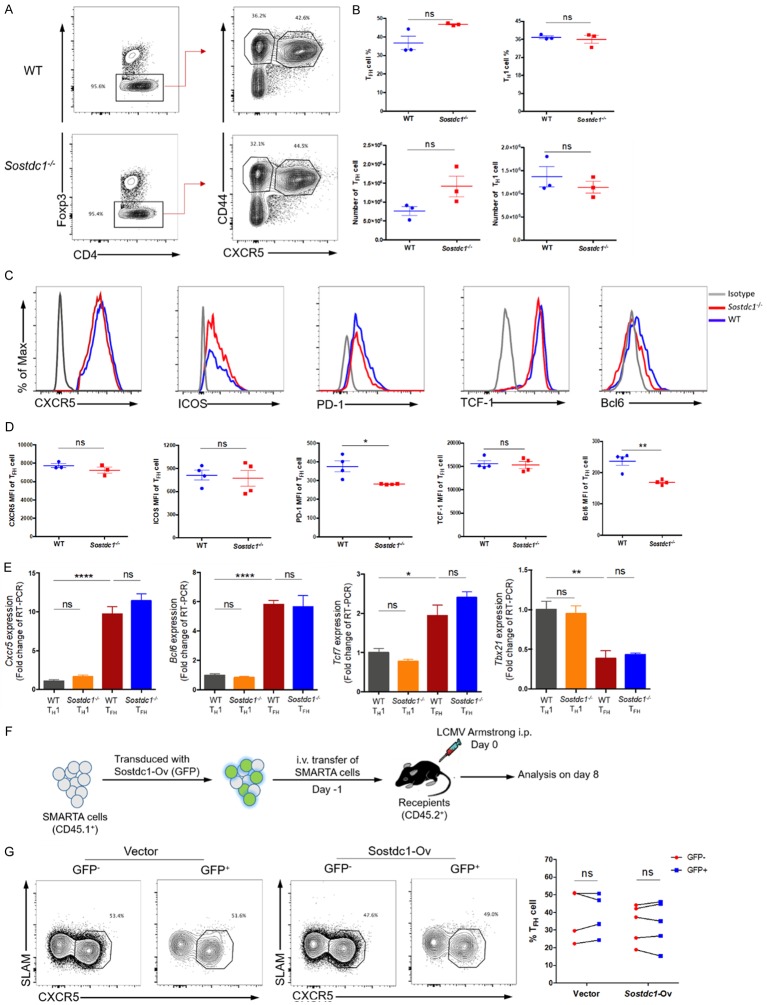
Figure 3.
SOSTDC1 is not required for TFH cell differentiation during acute viral infection. (A) Flow cytometry of CD4+ T cells in the spleens of either WT mice (WT) or Sostdc1 fl/fl Cd4-Cre mice (Sostdc1 -/-) on day 8 after LCMV Armstrong infection. The percentages of CD4+Foxp3- T cells (left), CD44+CXCR5+ T (TFH) cells and CD44+CXCR5- T (TH1) cells (right) in the WT (upper) and Sostdc1 -/- (lower) groups are indicated, and the statistical data are shown in (B). (C) Summary of CXCR5, ICOS, PD-1, TCF-1 and Bcl6 expression in TFH cells from the WT and Sostdc1 -/- groups calculated by subtracting the MFI of the isotype controls. (D) Statistical data for the expression levels of CXCR5, ICOS, PD-1, TCF-1 and Bcl6 in the TFH cells described in (A). (E) Quantitative RT-PCR analysis of Cxcr5, Bcl6, Tcf7 and Tbx21 gene expression in the TH1 and TFH cells described in A normalized to the corresponding expression levels in WT TH1 cells. (F) A brief summary of the experimental strategy is shown. SMARTA cells transduced with (GFP+) or not transduced (GFP-) with retrovirus expressing empty vector or a Sostdc1 overexpression plasmid were then transferred into recipients, which were subsequently infected with LCMV Armstrong the next day. (G) Flow cytometric analysis (left and middle) of the proportion of SLAM-CXCR5+ TFH cells in both GFP+ SMARTA cells and GFP- SMARTA cell populations on day 8 post infection as described in (F); the statistical data are shown to the right. The numbers adjacent to the outlined areas indicate the proportion of each cell type (A, G). The bars represent the standard errors (B, D, E). The p value was calculated by an unpaired t-test in (B, D, E) and by a paired t-test in (G); *P < 0.05, **P < 0.01 and ****P < 0.0001. ns, no significance. The bars in (B, D) and (E) represent the standard errors. The data are representative of the results of three independent experiments with at least three or four mice per group.

