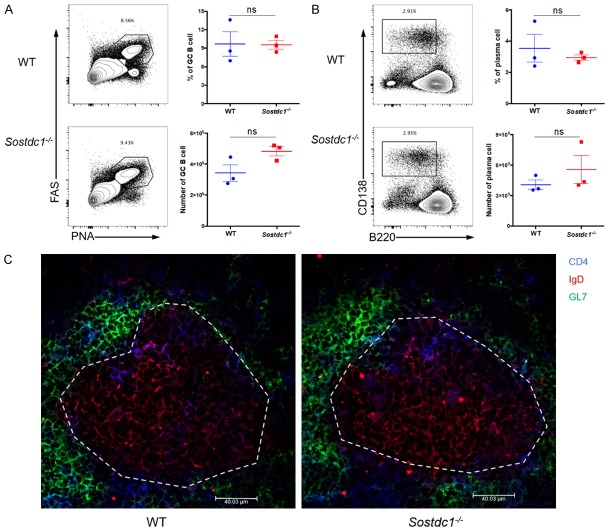
Figure 4.
SOSTDC1-deficient TFH cells show normal effector functions. (A) Flow cytometric analysis of cells in the spleens of either WT mice (WT) or Sostdc1 fl/fl Cd4-Cre mice (Sostdc1 -/-) on day 8 after LCMV Armstrong infection. The percentages of PNAhiFAShi GC B cells (gate on CD19+B220+) are indicated for the WT (upper) and Sostdc1 -/- (lower) groups (left), and the statistical data are shown (right). (B) Flow cytometric analysis (left) and statistical data (right) of CD138hiB220lo plasma cells (gated on CD19+) are indicated for the WT (upper) and Sostdc1 -/- (lower) groups. (C) Immunohistochemical staining of the spleens to visualize germinal centers of mice in the WT (left) and Sostdc1 -/- (right) groups on day 8 after LCMV Armstrong infection, the blue represent for the CD4+ T cells, the red represent for the IgD+ B cells and the green represent for the GL7+ B cells, whiter dotted lines indicate the margin of GCs. The numbers adjacent to the outlined areas indicate the proportion of each cell type (A, B). The bars represent the standard errors (A, B). The p value was calculated by an unpaired t-test (A, B). ns, no significance. The data are representative of the results of three independent experiments with at least three mice per group.

