Figure 5.
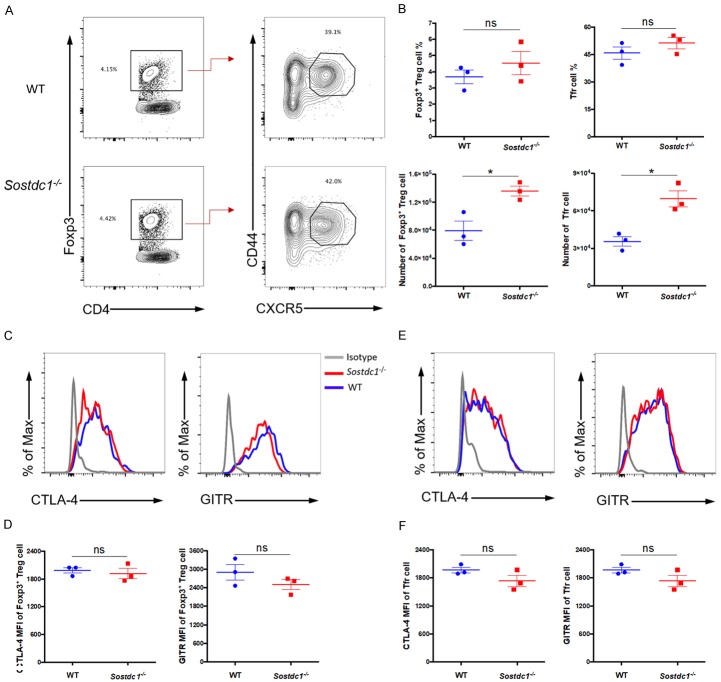
Roles of SOSTDC1 in Foxp3+ Treg cells and Tfr cells. (A) Flow cytometric analysis of CD4+ T cells in the spleens of either WT mice (WT) or Sostdc1 fl/fl Cd4-Cre mice (Sostdc1 -/-) on day 8 after LCMV Armstrong infection. (B) The percentages and numbers of CD4+Foxp3+ T (Foxp3+ Treg) cells and CD4+Foxp3+CD44+CXCR5+ T (Tfr) cells in the WT and Sostdc1 -/- groups are indicated. Summary of CTLA-4 and GITR expression in Foxp3+ Treg cells (C) and Tfr cells (E) in the WT and Sostdc1 -/- groups as calculated by subtracting the MFI of the isotype controls. The statistical data for (C) and (E) are shown in (D) and (F), respectively. The numbers adjacent to the outlined areas indicate the proportion of each cell type (A). The bars represent the standard errors (B, D, F). The p value was calculated by an unpaired t-test (B, D, F); *P < 0.05. ns, no significance. The data are representative of the results of three independent experiments with at least three mice per group.

