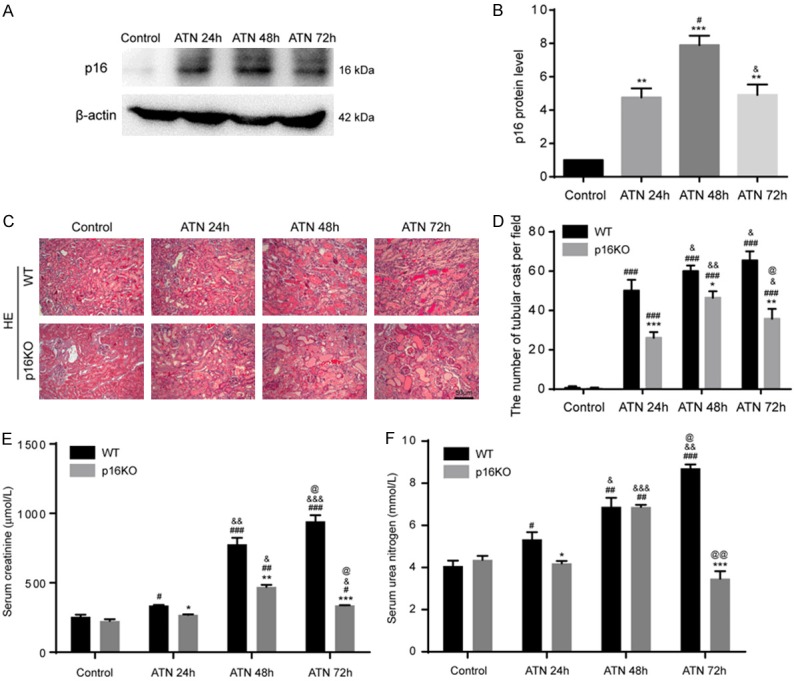
Figure 1.

P16 was increased in WT mice after ATN, and its deletion ameliorated ATN phenotype and renal function. A, B. Western blots of renal extracts showing p16 and β-actin was the loading control. Values are mean ± SEM of six determinations per group. **P < 0.01, ***P < 0.001 compared with control mice; #P < 0.05 compared with ATN-24 h group mice. C. Representative micrographs of paraffin-embedded renal cortex and medulla stained with HE from WT ATN mice and p16KO ATN mice at 24 h, 48 h, 72 h and control mice after the second dehydrated. D. Tube cast number was determined in HE-stained sections. E, F. Serum creatinine levels and serum urea nitrogen concentrations were determined by spectrophotometry. Values are mean ± SEM of six determinations per group. *P < 0.05, **P < 0.01, ***P < 0.001 compared with WT mice at the same time after ATN; #P < 0.05, ##P < 0.01, ###P < 0.001 compared with control at the same genotyped mice; &P < 0.05, &&P < 0.01, &&&P < 0.001 compared with ATN-24 h group at the same genotyped mice; @P < 0.05, @@P < 0.01 compared with ATN-48 h at the same genotyped mice.
