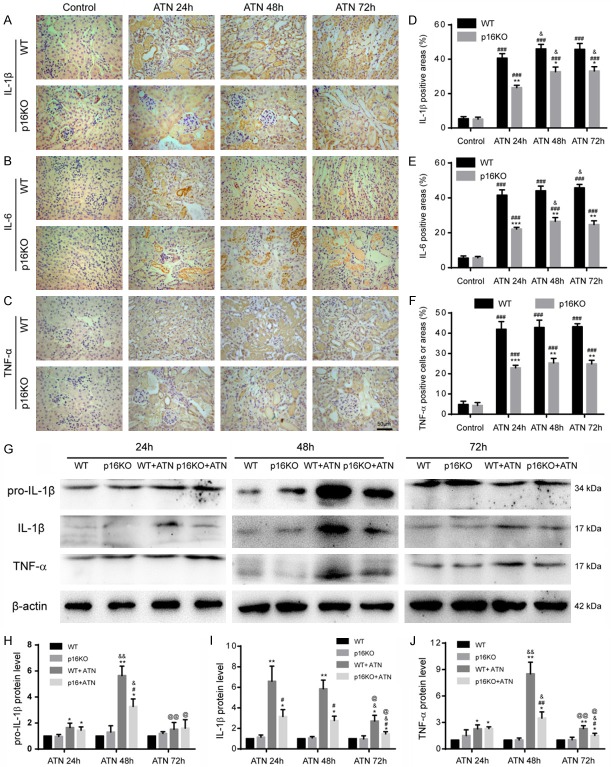
Figure 3.
P16 deletion reduced the production of inflammatory factors after ATN. A-C. Representative micrographs of paraffin-embedded renal sections immunohistochemically stained for IL-1β, IL-6 and TNF-α. D-F. Percentage of cells positive for IL-1β, IL-6 or TNF-α or positive areas relative to total cells or areas. Values are mean ± SEM of six determinations per group. *P < 0.05, **P < 0.01, ***P < 0.001 compared with WT mice at the same time after ATN; ###P < 0.001 compared with control at the same genotyped mice; &P < 0.05 compared with ATN-24 h group at the same genotyped mice. G. Western blots of renal extracts showing pro-IL-1β, IL-1β and TNF-α, and β-actin was the loading control. H-J. Protein levels relative to β-actin were assessed by densitometric analysis. Values are mean ± SEM of six determinations per group. *P < 0.05, **P < 0.01 compared with WT mice at the same time after ATN; #P < 0.05, ##P < 0.01 compared with control at the same genotyped mice; &P < 0.05, &&P < 0.01 compared with ATN-24 h group at the same genotyped mice; @P < 0.05, @@P < 0.01 compared with ATN-48 h at the same genotyped mice.

