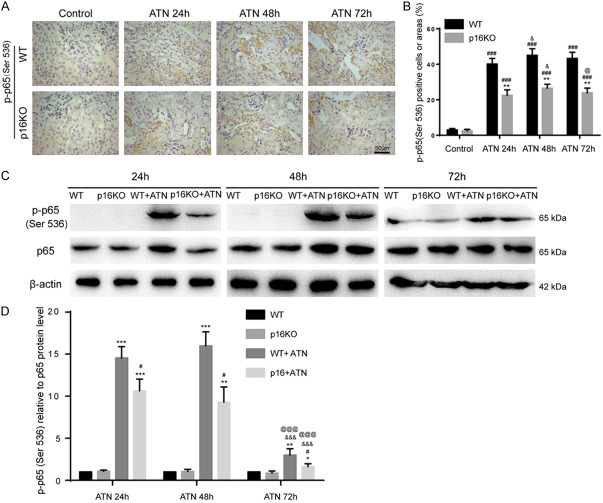
Figure 4.
P16 deletion inhibited the NF-κB proinflammatory pathway after ATN. A. Representative micrographs of paraffin-embedded renal sections immunohistochemically for p-p65 (Ser536). B. Percentage of cells positive for p-p65 (Ser536) or positive areas relative to total cells or areas. Values are mean ± SEM of six determinations per group. **P < 0.01 compared with WT mice at the same time after ATN; ###P < 0.001 compared with control at the same genotyped mice; &P < 0.05 compared with ATN-24 h group at the same genotyped mice; @P < 0.05 compared with ATN-48 h at the same genotyped mice. C. Western blots of renal extracts showing p-p65 (Ser536) and p65, and β-actin was the loading control. D. Protein levels relative to β-actin were assessed by densitometric analysis. Values are mean ± SEM of six determinations per group. *P < 0.05, **P < 0.01, ***P < 0.001 compared with WT mice at the same time after ATN; #P < 0.05 compared with control at the same genotyped mice; &&&P < 0.001 compared with ATN-24 h group at the same genotyped mice; @@@P < 0.001 compared with ATN-48 h at the same genotyped mice.

