Figure 2.

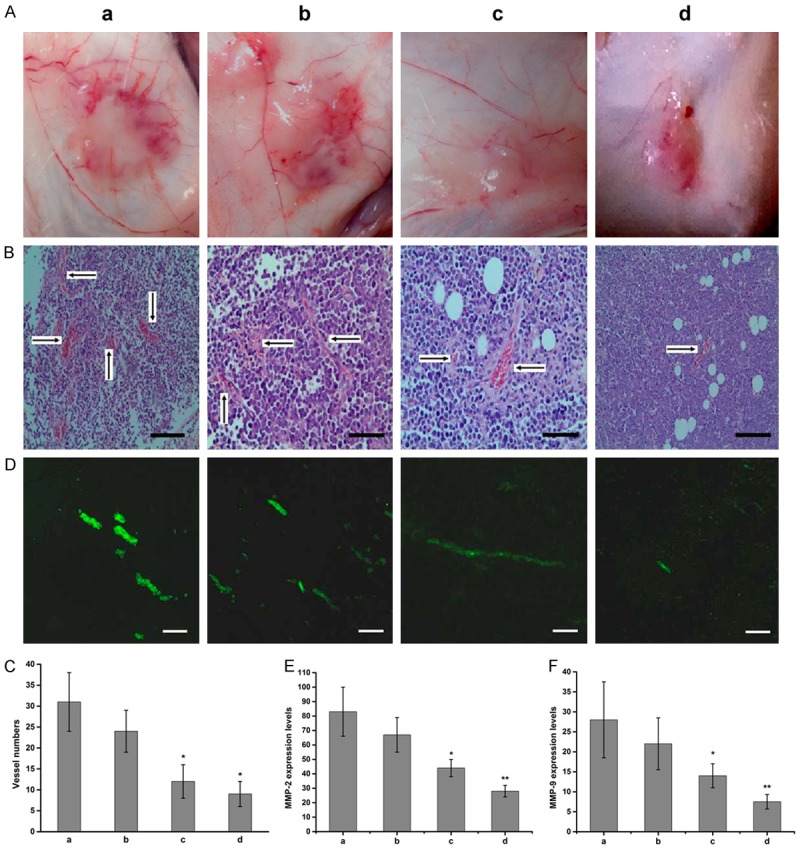
TCS inhibits tumor angiogenesis and the expression of MMPs. A. Photograph of peritumorous angiogenesis in each group. B. Measurement of tumor micro vessel density (MVD) by Hematoxylin and Eosin (HE) staining in control and TCS treated mice. Bar, 20 μm. C. Quantitative analysis of tumor MVD (n = 5, magnification 200). D. Representative immunofluorescence images of blood vessel formation in subcutaneous tumors stained with platelet endothelial cell adhesion molecule-1 (CD31-FITC) (green) (200). Bar, 10 μm. E. The expression levels of MMP-2 in serum of A20 inoculated mice (n = 5, P < 0.05, P < 0.01 vs. group a). F. The expression levels of MMP-9 in serum of A20 inoculated mice (n = 5, P < 0.05, P < 0.01 vs. group a). Data are represented by the mean ± SD. a: saline control group; b: 0.2 mg/kg TCS group; c: 0.4 mg/kg TCS group; d: 0.8 mg/kg TCS group.
