Figure 3.
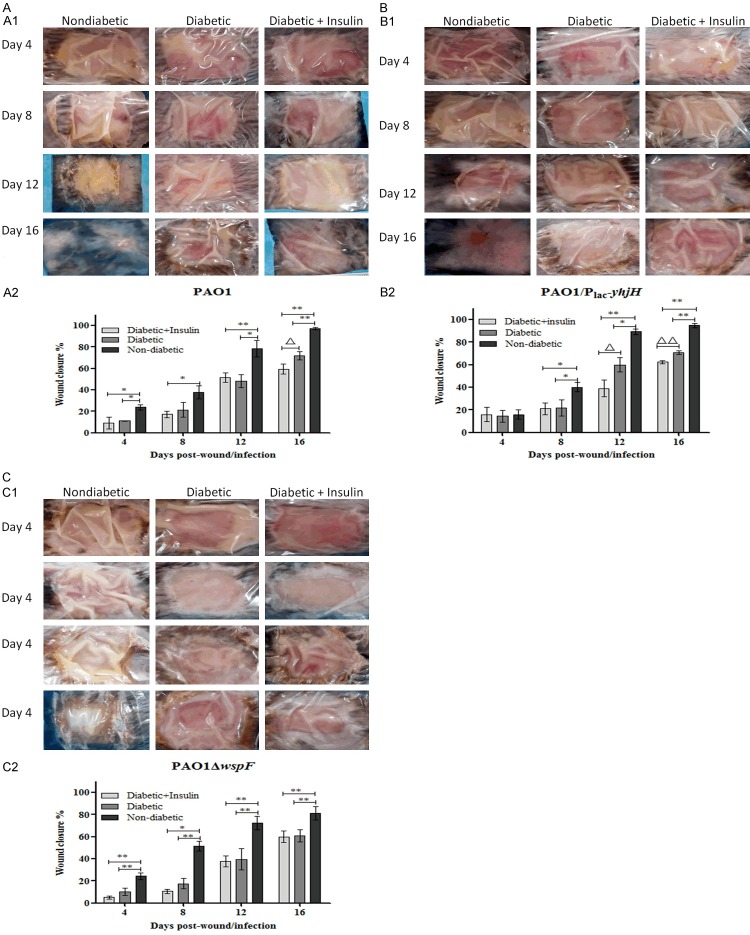
(A) Wound closure in the P. aeruginosa infection model was delayed in the PAO1 control group of diabetic mice. All wounds were measured at 4-day intervals to assess wound closure (representative images are shown in A1). The percent wound closure was determined using the following equation: (A0-At)/A0 × 100, where A0 was the wound area on the day of surgery, and At was the wound area on the day of observation (A2). One-way analysis of variance (ANOVA) followed by the Tukey-Kramer multiple comparison test was used. Note: *P < 0.05 compared with the nondiabetic group, **P < 0.01 compared with the nondiabetic group, ΔP < 0.05 compared with the diabetic group. (B) Wound closure in the P. aeruginosa infection model was delayed in the PAO1/Plac-yhjH-infected group of diabetic mice. All wounds were measured at 4-day intervals to assess wound closure (representative images are shown in B1). The percent wound closure was determined using the following equation: (A0-At)/A0 × 100, where A0 was the wound area on the day of surgery, and At was the area of the wound on the day of observation (B2). One-way analysis of variance (ANOVA) followed by the Tukey-Kramer multiple comparison test was used. Note: *P < 0.05 compared with the nondiabetic group, **P < 0.01 compared with the nondiabetic group, ΔP < 0.05 compared with the diabetic group, ΔΔP < 0.01 compared with the diabetic group. (C) Wound closure in the P. aeruginosa infection model was delayed in the PAO1ΔwspF-infected group of diabetic mice. All wounds were measured at 4-day intervals to assess wound closure (representative images are shown in C1). The percent wound closure was determined using the following equation: (A0-At)/A0 × 100, where A0 was the wound area on the day of surgery, and At was the area of the wound on the day of observation (C2). One-way analysis of variance (ANOVA) followed by the Tukey-Kramer multiple comparison test was used. Note: *P < 0.05 compared with the nondiabetic group, **P < 0.01 compared with the nondiabetic group.

