
Figure 1.
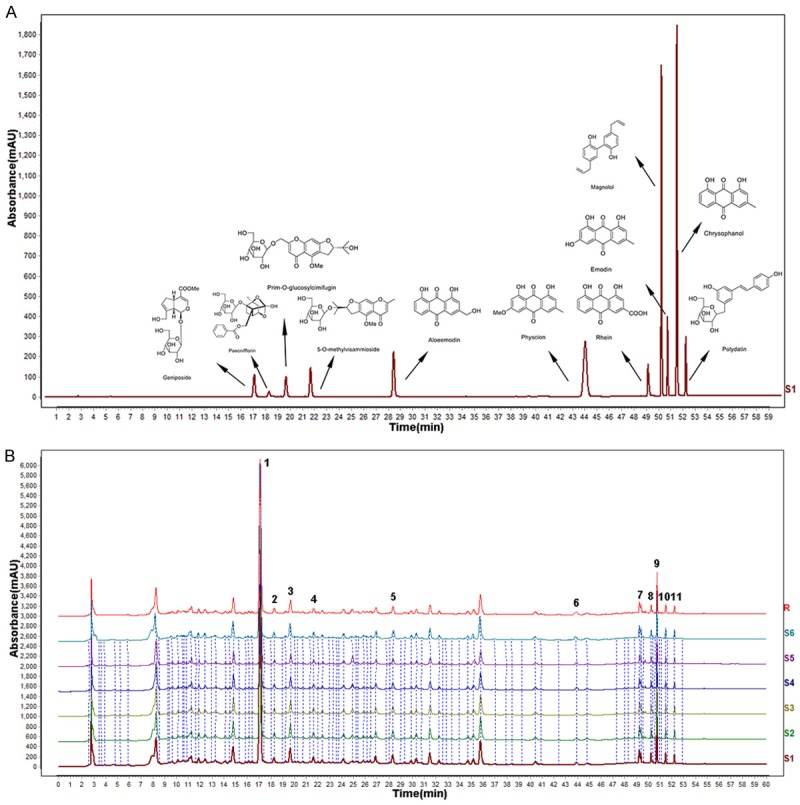
The chemical profile of TSTs determined at 254 nm via HPLC-UV analysis. Notes: A. The standard curves for each compound. B. The chemical contents of TSTs.
Official websites use .gov
A
.gov website belongs to an official
government organization in the United States.
Secure .gov websites use HTTPS
A lock (
) or https:// means you've safely
connected to the .gov website. Share sensitive
information only on official, secure websites.
The chemical profile of TSTs determined at 254 nm via HPLC-UV analysis. Notes: A. The standard curves for each compound. B. The chemical contents of TSTs.