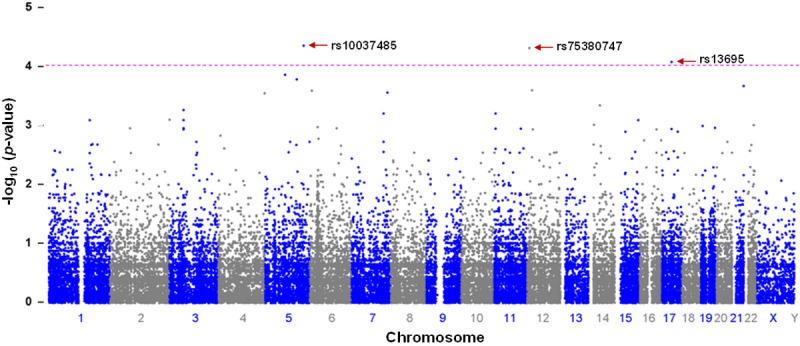
Figure 1.

Manhattan plot of putative functional exonic (n = 243,345) variants in the molecular genetics of low VO2max from association study. The-log10 (p-values) from the association are plotted according to variant position on each chromosome. Positions of candidate SNP biomarkers of functional exonic variants at CYFIP2 and FNDC9 (rs10037485), and C1R (rs75380747) and TOP2A (rs13695) on chromosome 5, 12 and 17, respectively for low VO2max are indicated by arrows. The horizontal dotted line indicates the suggestive threshold of p 1.00 × 10⁻⁴.
