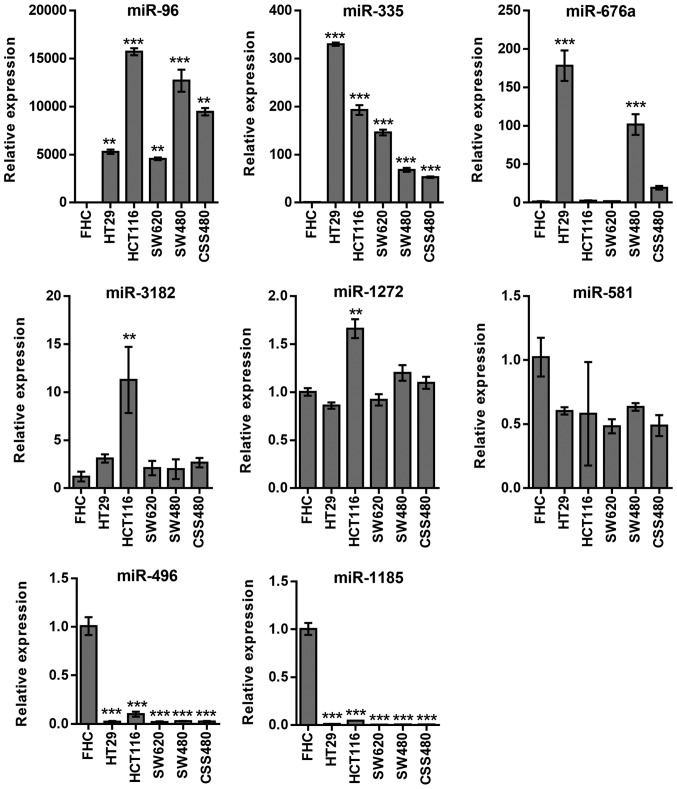
Figure 2.
Quantitative-PCR analysis of differentially expressed miRNAs in association with mTOR expression in 5 human colorectal cancer cell lines, stimulated with insulin (200 nM). The data presented revealed that miRNAs, miR-96, miR-335 and miR-767 were upregulated, whereas miR-1272 and miR-581 were unchanged compared to FHC cells. Number of repeats, 3. **P≤0.01; ***P≤0.001. miRNA, microRNA; mTOR, mammalian target of rapamycin.

