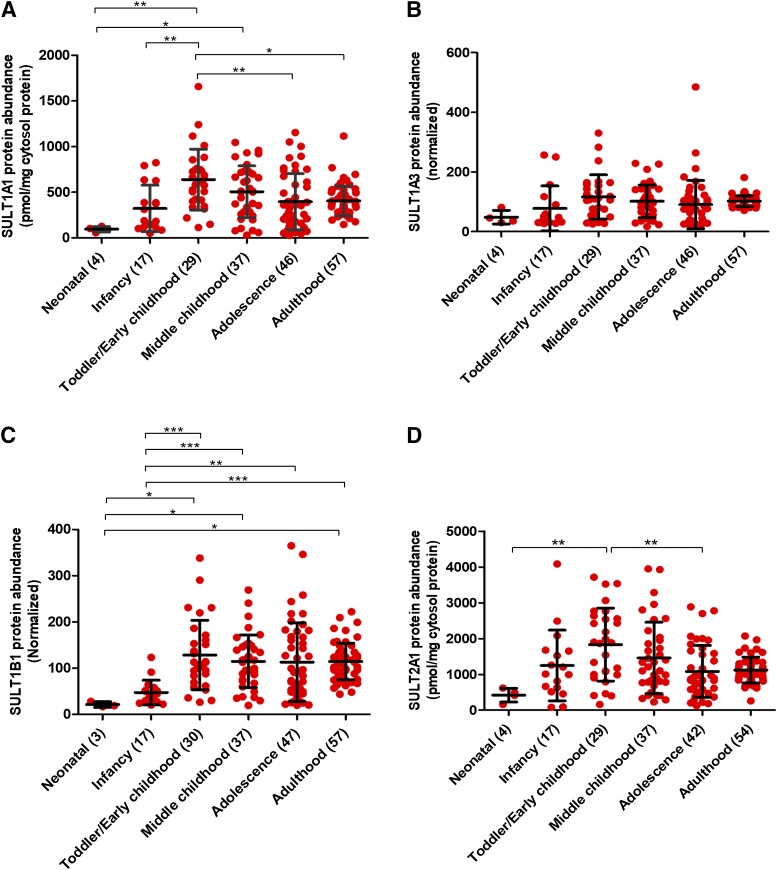
Fig. 1.
Age-dependent abundances (categorical) of SULT1A1 (A), SULT1A3 (B), SULT1B1 (C), and SULT2A1 (D) across six developmental periods, i.e., neonatal (0–27 days); infancy (28–364 days), toddler/early childhood (1 to <6 years), middle childhood (6 to <12 years), adolescence (12–18 years), and adulthood (>18 years). Statistical analysis for intercomparison of enzyme abundance across different age groups was performed using Kruskal-Wallis test followed by Dunn’s multiple comparison test. The number of samples in each age category is indicated in parentheses on the x-axis. Data for SULT1A1 and SULT2A1 represent absolute protein levels (determined using protein standard calibrator), whereas SULT1A3 and SULT1B1 data are presented as relative data (normalized by pooled quality control values). *, **, and ***P values < 0.05, <0.01, and <0.001, respectively.

