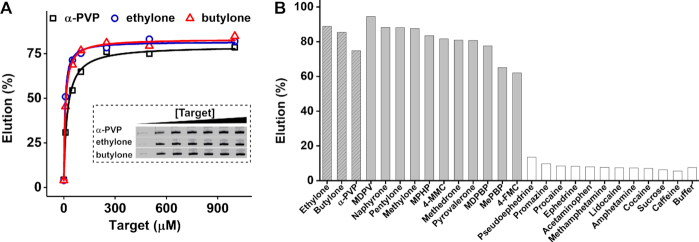
Figure 2.
Characterization of the affinity and specificity of the final enriched pool via a gel-elution assay. (A) PAGE results depict the target elution profile, with lanes representing samples of the pool eluted with 0, 10, 50, 100, 250, 500 or 1000 μM (from left to right) α-PVP, ethylone or butylone. The percent of target-eluted pool was plotted against the concentration of target to determine the binding affinity of the enriched pool. (B) Percent elution values for 14 synthetic cathinones and 11 interferents at a concentration of 50 μM and buffer alone.

