
Figure 3.
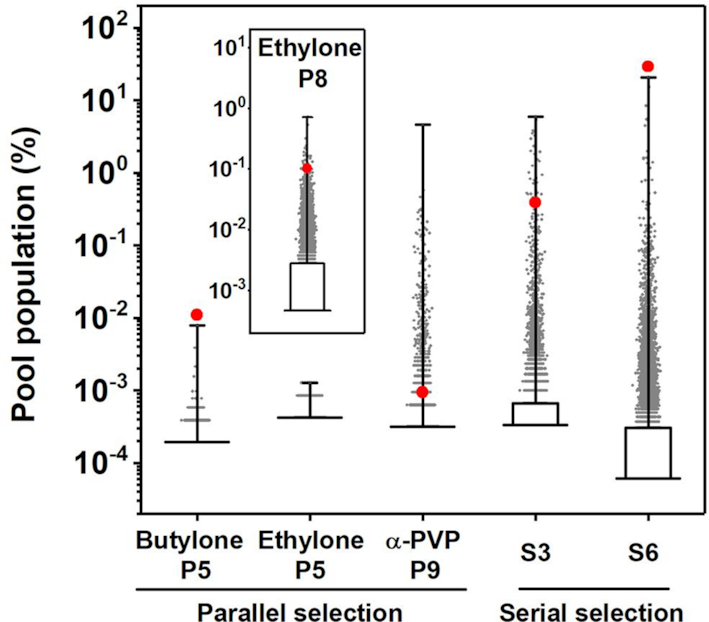
Box and whisker plots of the population distribution of sequences after parallel selection (butylone P5, ethylone P5, ethylone P8 and α-PVP P9) and each round of serial selection (S3 and S6) are shown. The longest horizontal line indicates the 50th percentile, with the boundaries of the box indicating the 5th and 95th percentile, and the whiskers indicate the highest and lowest values of the results. Sequences with population above 95th percentile are plotted as gray dots. The total population of SCA2.1 family is plotted as a red dot in each pool, except for the ethylone P5 pool where no such sequences were detected. Inset shows the pool population distribution after eight rounds of parallel selection using ethylone as target. Given the high diversity of the parallel pools, the lowest values 5th, 50th and 95th percentile all overlap, thus the box and lowest whisker cannot be seen. For the serial pools, the lowest values, 5th, and 50th percentile overlap, thus the bottom portion of the box and the lowest whisker are likewise not apparent.