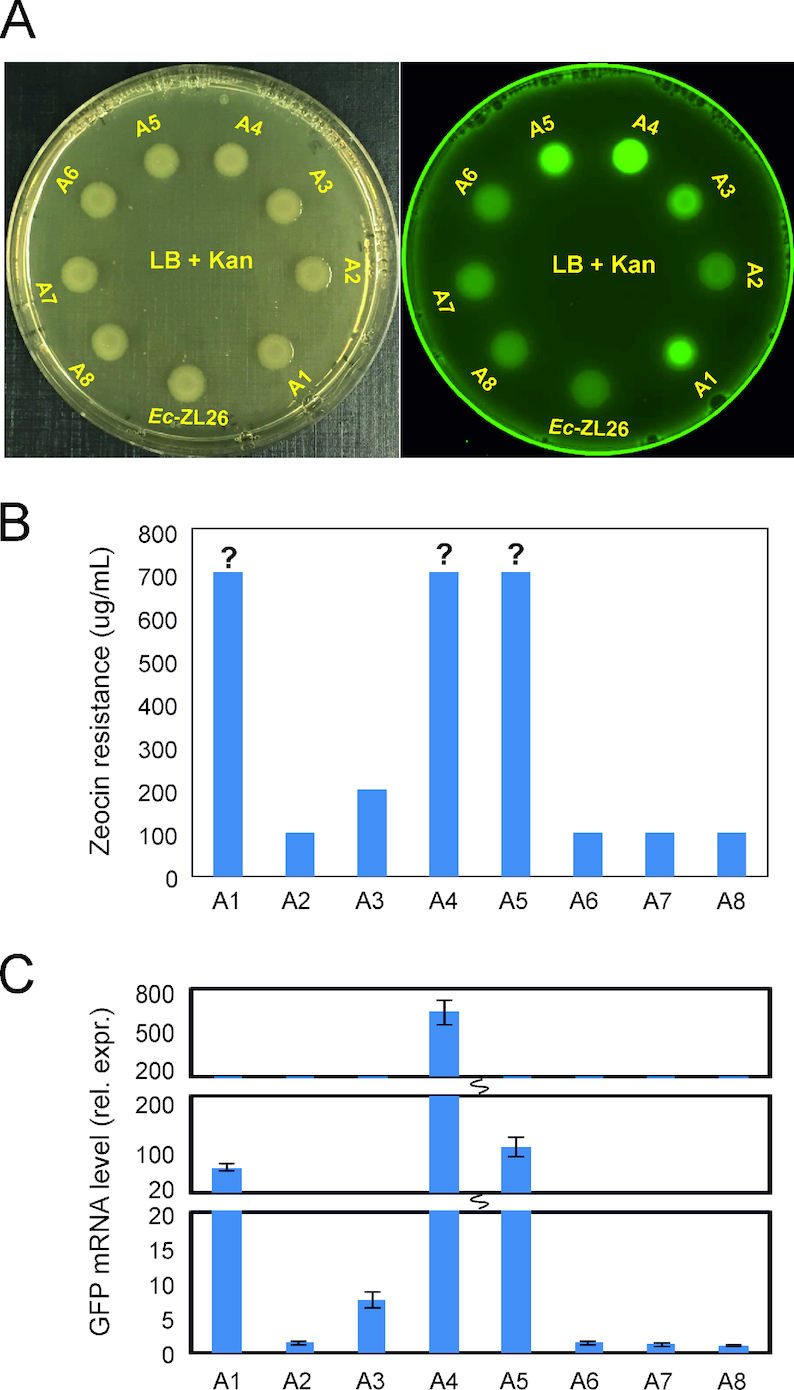
Figure 2.

Expression levels of the ble-GFP gene differ between the activation events. (A) Analysis of GFP fluorescence of zeocin-resistant colonies. The left plate was photographed under daylight, the right plate was scanned with laser light to visualize the green fluorescence of GFP (see ‘Materials and Methods’ section). (B) Zeocin tolerance tests to determine the antibiotic resistance level by assaying growth on LB plates with zeocin concentrations between 100 and 700 μg/mL. Question marks indicate that the resistance level may be even higher, but concentrations higher than 700 μg/mL were not tested. (C) Quantification of GFP mRNA accumulation in zeocin-resistant clones by qRT-PCR. Relative expression levels (rel. expr.; normalized to Ec-ZL26-A8, the strain with the lowest GFP expression levels) are shown. Error bars represent the standard deviation from three biological replicates.
