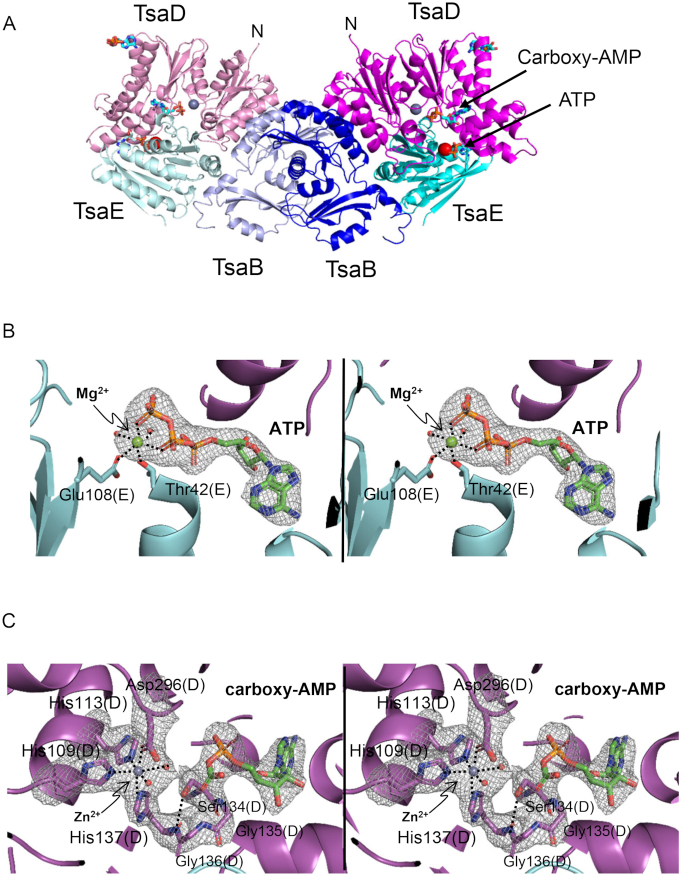
Figure 2.
Overall structure of TmTsaB2D2E2 in complex with ATP and carboxy-AMP. (A) Ribbon diagram of the complex showing locations of the ATPase site and TC-transfer site. Subunits TsaB, TsaD and TsaE are colored in two shades of blue, magenta and cyan, respectively. Bound Zn2+ and Mg2+ ions are shown as gray and red spheres, respectively, and bound nucleotides as stick model and labeled. (B) Stereoview of the omit Fo-Fc electron density map (2.5 Å, contour level 4.5σ; nucleotide, ion, and water molecules were omitted from the refinement and phase calculation) of ATP and Mg2+ bound in the interfacial ATPase site between TsaD and TsaE. (C) Stereoview of the omit Fo– Fc electron density map (2.5 Å, contour level 3.2σ; nucleotide, water, metal and surrounding residues were omitted from the refinement and phase calculation) in the TC-transfer site showing bound carboxy-AMP and Zn2+ and an ordered active site. Metal coordination spheres and the intraloop hydrogen bond between Ser134 and His137 are indicated with dashed lines.

