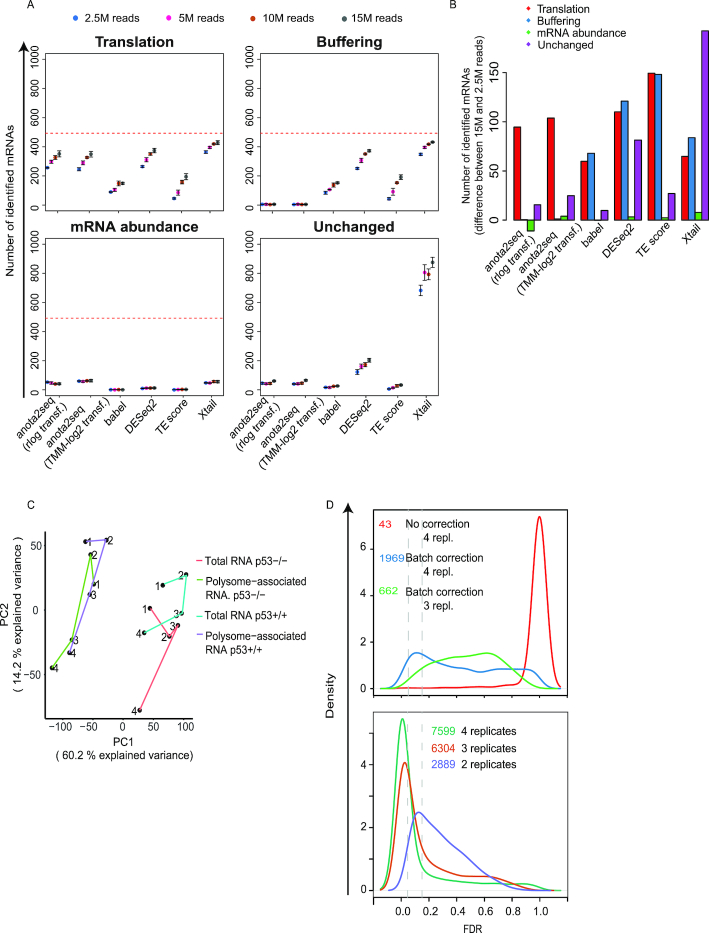
Figure 5.
Evaluation of sensitivity to sequencing depth during analysis of changes in translational efficiency affecting protein levels. (A) Numbers of mRNAs identified as differentially translated from the translation (TP), buffering (FP), mRNA abundance (FP) or unchanged (FP) sets (Figure 1A) are indicated for each method at a 15% FDR threshold (mean and standard deviations from 5 simulated data sets are indicated) (B) Difference in the number of mRNAs identified as differentially translated (FDR < 0.15) belonging to the four sets in (A) when changing the sequencing depth from 15 million to 2.5 million reads (mean from 5 simulated data sets). Red lines indicate the total amount of mRNAs simulated for each set of regulated transcripts. (C) PCA analysis of the RNAseq data set from Liang et al. Lines connect replicate experiments (individual replicates are indicated by numbers). PC: Princinpal component (D) Density plots of adjusted p-values (FDRs) from analysis of changes in translational efficiencies leading to altered protein levels using anota2seq and RNAseq data from Liang et al. (top) or Guan et al. (bottom). Vertical line indicates a 5% and 15% FDR threshold. Numbers of identified mRNAs are reported at a 15% FDR threshold. All possible replicate combinations were analyzed when using three or two replicates and the mean number of identified mRNAs is indicated.

