
Figure 2.
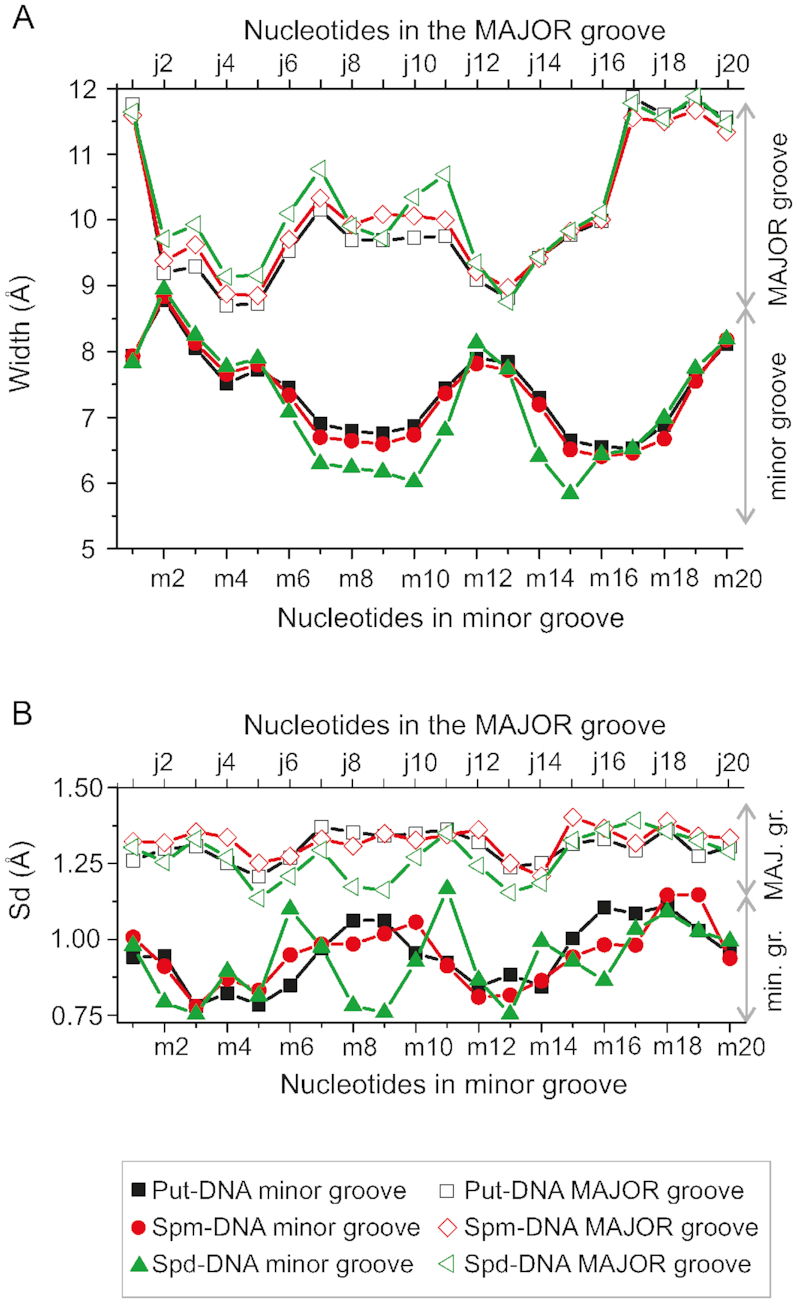
The dependencies of the average width (A) and standard deviations (B) of the minor and major grooves on nucleotide step. Black, red and green colors correspond to Put-DNA, Spd-DNA and Spm-DNA systems, respectively. To determine the van der Waals width of the groove the radius of the phosphates (5.8 Å) has been subtracted from the values of distances between phosphate groups. The numeration of the nucleotide steps from the minor and major groove sides are according to the Figure 1.