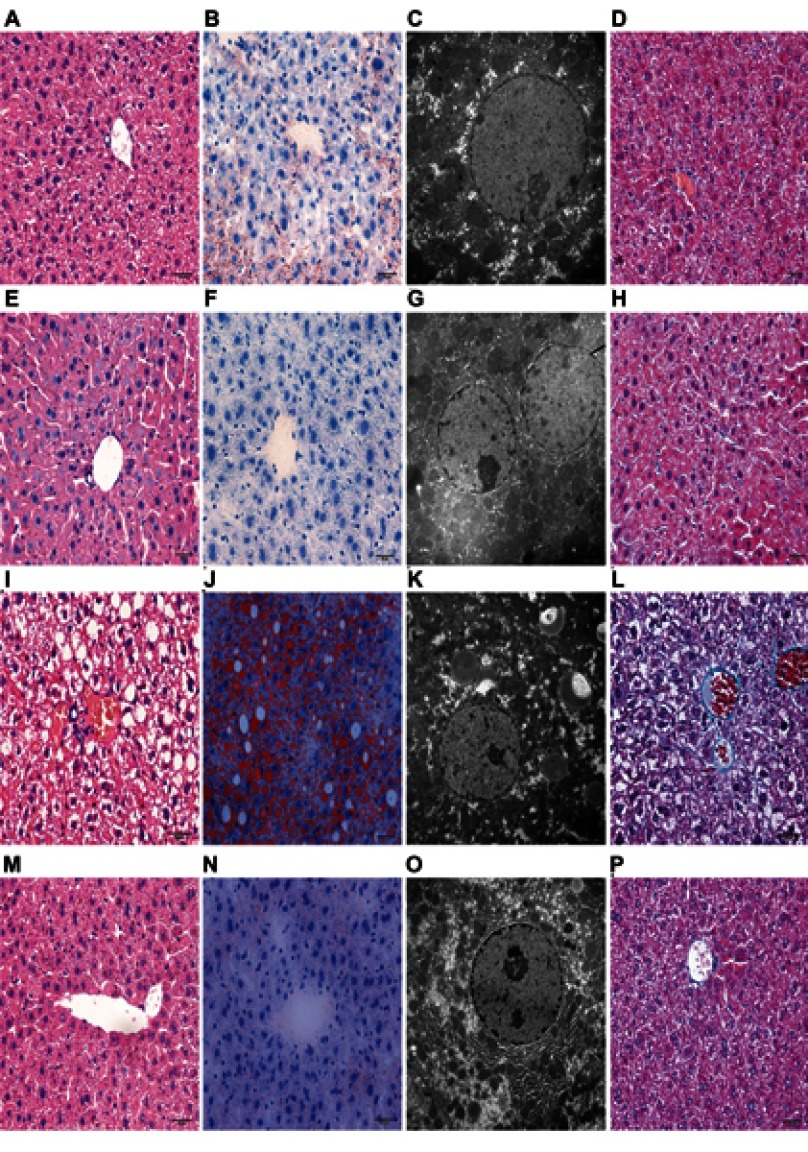
Figure 4.
Histological evaluation of liver tissues with HE, Oil Red O staining, Mosson staining and transmission electron microscopy. Histological evaluation of liver tissues in each group stained with HE (×400), Oil Red O (×400) and Mosson staining (×400). Ultrastructural changes in liver tissues from each group (×10,000). ie, HE (A, E, I and M); Oil Red O (B, F, J and N); Mosson staining (D, H, L and P); transmission electron microscopy (C, G, K and O); N+S group (A, B, C and D); N+L group (E, F, G and H); O+S group (I, J, K and L); O+L group (M, N, O and P).
Abbreviations: HE, hematoxylin and eosin staining; N+S, a normal saline-treated group; N+L, a Liraglutide-treated group; O+S, a normal saline-treated group; O+L, a Liraglutide-treated group.

