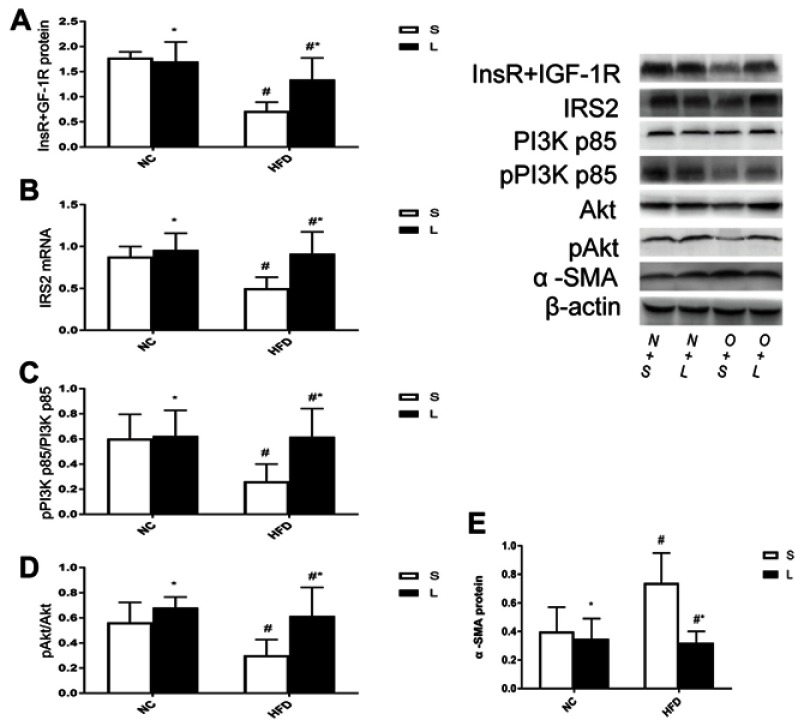
Figure 6.
InsR+IGF-1R, IRS2, pPI3K p85/PI3K p85, p Akt/Akt and α -SMA levels in mice after Liraglutide (L) or saline (S) treatment. Data were mean±SD (n=6 each group). p-values for the interactive effects of HFD and Liraglutide treatment on InsR/IGF-1R, IRS2, pPI3K p85/PI3K p85, p Akt/Akt and α -SMA levels were 0.011, 0.039, 0.044, 0.114 and 0.01, respectively. ie, InsR/IGF-1R (A); IRS2 (B); pPI3K p85/PI3K p85 (C); p Akt/Akt (D); α -SMA (E). *p<0.05 for the comparison of the saline and Liraglutide groups; # p<0.05 for the comparison of NC and HFD groups.
Abbreviations: InsR, insulin receptor; IGF-1R, insulin-like growth factor-1 receptor; IRS2, insulin receptor substrate 2; PI3K p85, PI3 kinase p85; Akt, protein kinase B; α -SMA, α - smooth muscle actin; HFD, high-fat diet; NC, the mice fed with a normal chow diet.

