Figure 2.
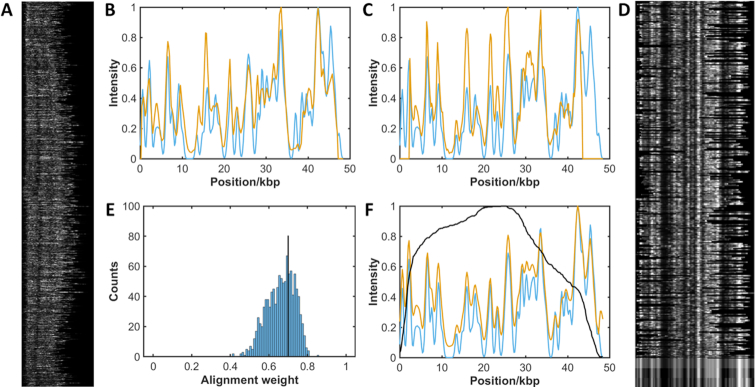
Alignment of pure experimental sample of the bacteriophage lambda genome. DNA was labelled with Atto647N using M.TaqI to direct labelling, combed and imaged. 38,000 candidate DNA barcodes were extracted from the images. (A) After filtering the experimental data, 1077 barcodes are identified for further analysis. (B and C) The fluorescence intensity profile of each experimental DNA barcode (red) is cross-correlated with a reference molecule (blue) to find the optimal stretch and alignment of the data. (D) Selected barcodes (368) with an alignment weight greater than the threshold. At the bottom of the image is shown the mean experimental barcode, the mean with the background removed and the reference barcode (top to bottom). (E) Alignment weight for all experimental barcodes is calculated and a threshold (of 0.7 in this case) is applied (black line). (F) Plot of mean experimental barcode (red) against the reference barcode (blue), with the number of barcodes (black).

