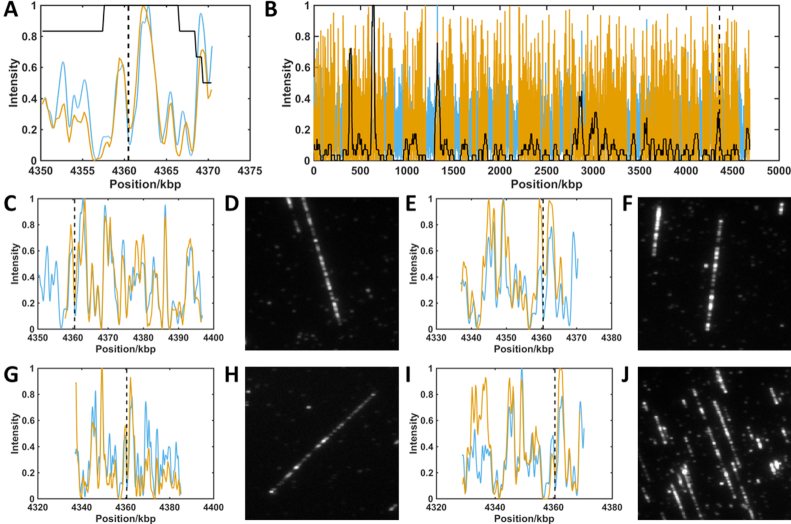
Figure 3.
Localization of barcodes containing a CRISPR/Cas9 edit. Red lines show experimental barcode profiles. Blue lines show reference genome profiles. Black dashed lines show the expected position of the edit on the genome. Values in parenthesis below show alignment weight to reference. (A) Consensus barcode generated from all barcodes overlapping with at least 25% of the region of interest. A maximum (minimum) of 35 (18) barcodes (solid black line) contribute to the consensus (0.963). (B) Consensus of all barcodes aligned to the genome reference. A maximum (minimum) of 168 (0) barcodes (solid black line) contribute to the consensus across the genome (0.815). (C, E, G, I) Single molecule barcodes aligned to region of interest (0.866, 0.864, 0.860, 0.831). (D, F, H, J) Raw images of barcodes (shown in C, E, G and I, respectively) identified as overlapping region of interest.

